tecznotes
Michal Migurski's notebook, listening post, and soapbox. Subscribe to ![]() this blog.
Check out the rest of my site as well.
this blog.
Check out the rest of my site as well.
Dec 25, 2009 8:34am
explaining in video
Phil Gyford wrote:
Like you, when I read two mentions of the same concept within a few days, I exclaim in a voice hearty enough for all to hear, "That's a blog post!" I am barely tolerated by the librarians.
My threshold, three, is slightly higher. Here are three examples of recent explanatory videos that all use a similar visual technique to help communicate a point.
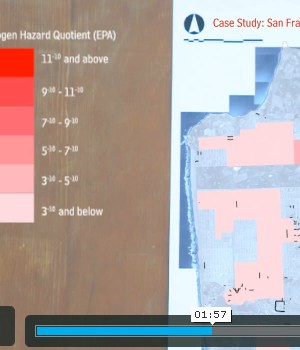
First is Local Code : Real Estates, a finalist in the WPA 2.0 competition sponsored by UCLA Citylab. It's an exploration of so-called paper or unnaccepted streets, and the uses they might be put to as agricultural or garden spaces. I hesitate to say too much, because my colleague Sha Hwang helped produce the video, but the project here overstates its case a bit. There may be a few square miles of unaccepted streets in SF, but a lot of the big ones are in completely shitty places, saturated by decades of industrial ground poison and far from people who might care for them. Still, the maps in this explanation are just lovely. They are presented as physical artifacts with digital overlays, often visibly laid down on a desk prior to HUD activation.
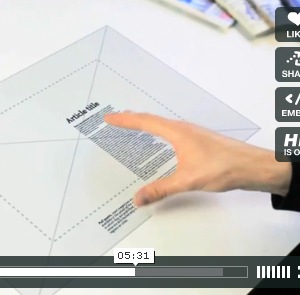
This video from UK Stamen pals BERG presents a hypothetical future magazine browsing concept, recently characterized as a "mating call" from publishers to Apple's rumored tablet device. Jack explains the navigation metaphor while pointing at a virtual desk display interspersed with other magazines. The proposed device is shown in use, on a train, in a kitchen with overlaid graphics and simulated hand motions.
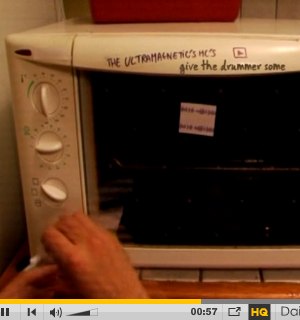
Finally Anthony from Hype Machine links to this dissection of the Prodigy track Smack My Bitch Up, showing how it is constructed from previous pop music with a sort of paper prototype of a beat loop, with bits of tape and marker used for interface.
Each of these videos bounces physical, shaky reality off of digital graphics. The Prodigy making-of video pulls in animated play heads and jokingly deputizes a microwave timer as a pitch bender. Sha matches GIS-style graphics to loosely-positioned maps of San Francisco, rapidly communicating the informal attainability of the project and the kind of workmanship of risk ultimately necessary to pull it off in physical reality. The BERG video is the superstar in this collection, perfectly meshing objective reality and objective content of thought. Designer Timo Arnall is responsible for this seamlessness here and in a few other similar concept videos, and he's elevated the state of this particular art to an absurd level. I get goosebumpy just watching this thing over and over - look how every bit of shake and depth-of-field in the recorded image is perfectly followed by the overlaid concept graphics. Jack and Timon have managed to communicate the functionality of a nonexistent digital device in post-production, using just a piece of plastic and some hand motions as a stepping stone.
Anyway, look, it's Christmas. Time to crash out.
Dec 20, 2009 6:14am
break
Why haven't I posted to this blog for almost two months? I hesitate to say "I'm busy" (even though it's true), but the real reason is that there's a sudden, astonishing volume of beauty and novelty flooding the web right now, and I've been content to play the fan for a few months, catching little bits of it as they stream by almost too quickly to follow. I'm doing quiet background things and trying to stay upright in the face of total inundation. It's my inputs that are busy, not my outputs. Big difference.
Most of what's coursing through the channels can be found here and here.
Now it's Christmas break, and I'm going to see if I can't pull together a tangible thing or two. Will report back later.


Too much.

Nov 2, 2009 7:31am
the future is staring us in the face
That's the line we use around the office whenever the subject of HTML and canvas comes up - we use Adobe Flash for most everything now, but we don't expect that situation to last forever. The work done by Mozilla on Gecko and Apple on WebKit is one possible future for online design and visualization, and it's turning slowly to face us right about now.
A few developments during recent years have brought us here.
One of the first widespread demonstrations of canvas viability as an interactive medium came from legendary Javascript developer John Resig, who ported the popular educational / artistic Processing environment to Javascript and released Processing.js to the world in May 2008 or so, just about 1 1/2 years ago. At the time, the library was lauded as an "amazing hack" (Andy Baio). Christopher Blizzard said:
The web is going to win, filling the market niche where Flash and other similar technologies found their hold. And John's little project can hopefully act as a great catalyst to take us there. Thanks, John!

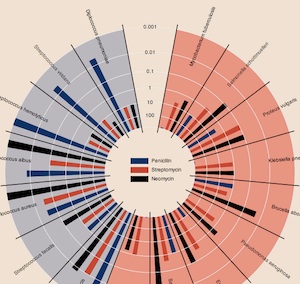
Earlier this year, Mike Bostock and Jeffrey Heer at Stanford released Protovis, a visualization toolkit focused on the use of "marks" to build up graphical charts and visualizations from raw Javascript function chains. The library is currently implemented using SVG, but when they first launched everything rendered smartly to HTML canvas. The language Mike and Jeff developed to express these marks is succinct, and beautifully flips the logic of normal charting on its head: instead of decided on (say) a pie chart at the outset and filling in the constituent wedges, you build up a complete chart from patterns of basic geometry and data. You might end up with a pie chart in the end, but you might also end up with something much more subtle and expressive, like this reinterpretation of Burtin's antibiotics chart. I dare you to try this with Google Chart API.
Finally, as we work on increasing amounts of public, government, and civic work, we're mindful of the relative opacity of Adobe's various transmission formats, as noted by Sunlight Labs in Adobe Is Bad For Government. They're talking about PDF files in particular, but I liked this excerpt from an Adobe open government white paper: "Since the advent of the web, an entire infrastructure has evolved to enable public access to information. Such technologies include HTML, Adobe PDF, and Adobe Flash technology." Not wrong, necessarily, but then again Froot Loops is also part of a balanced breakfast so there you go.
Anyway, interesting times.
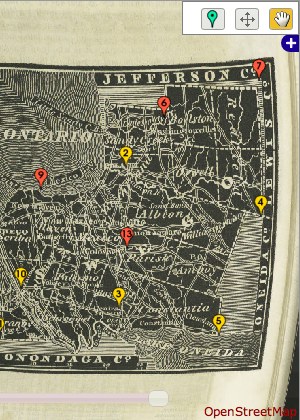
Usually when I experiment with a new technology like this one, it's nice to revisit an old problem or two, to see if some new light can be shed on it with a new tool. Coincidentally, while John Resig was releasing Processing.js in May 2008, I was busy working on some ideas for flea market mapping. I had recently found GDAL, a toolkit for manipulating digital raster maps, and rubbersheeted a collection of old Oakland road and real estate maps to match the one true cartographic projection. The annoying bit in the middle of this process is a three-way dance between a graphics program, a web browser, and a text editor for the collection of ground control points used to warp the image:
One of the simple things that canvas can do really well is transform and clip bitmaps, so it's possible to take an image file, turn it into a set of triangles, twist and bend them, and rapidly render the result. Cassidy Curtis clued me in to the linear math behind these operations many years ago, it really does just turn out to be a bunch of arithmetic.
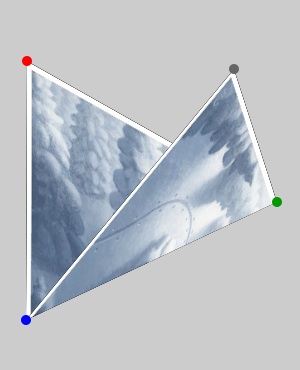
This will be important later.
A thing about triangles is that there are some good algorithms for taking a bag of points and making sets of triangles out of them. Delaunay triangulation in particular is a simple, aesthetically pleasing mesh useful for dividing up a space defined by known points. Fred Scharmen has been writing about manual performance of graphics algorithms, and he has an excellent recent post on drawing the Delaunay triangulation and the Voronoi diagram.
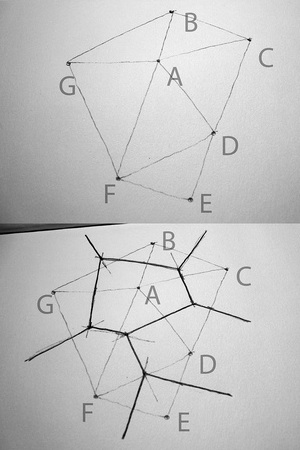
Amsterdam designer Jonathan Puckey has been exploring a similar vein with his triangulated portraits, though sticking to the computer all the same.

The algorithm is quite simple, trivially easy to implement in Javascript. Look, here's mine:

Put these things together, and you get a way to perform image deformation and rubbersheeting in the browser without the use of Flash. I wrote a demo that shows a few pieces in action. First, it uses the Javascript port of Modest Maps, and introduces a map provider based on Zoomify for the manipulation of potentially very large tiled images. Second, it overlays each interactive map with a canvas element. One is used to display the triangulated mesh of control points, the other shows a preview of the image deformed to match the underlying geography. You can see here how five points nicely handle the area around downtown Oakland:
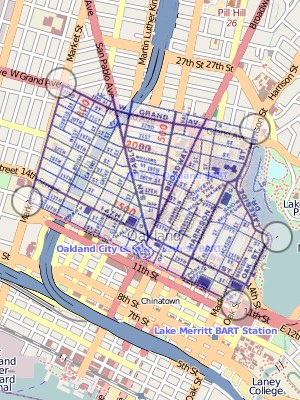
Both maps can be panned around, and zoomed with the mousewheel. Move the circular control points around on each side to see how they change the visual display. I've tested this with Firefox and Safari on a Mac, and the resulting interaction is just a little bit snappier in the latter. There's a distracting visual flickr in both, which I'm sure could be dealt with by double-buffering the canvas or some similar optimization.
There are a few things here I really like about the canvas interface. It seems to use a stack model for the drawing state (with save() and restore() instead of the more traditional, cryptic push() and pop()) to save things like clipping paths and coordinate transformations. This makes it possible to load the image pyramid tiles into the warped view asynchronously, throwing a transformation and clipping triangle into an array with a bunch of closures and callbacks to blit out pixels when images are loaded. It's not particularly encapsulated or object-oriented, but it does keep the pixel manipulation model working consistently. Something that canvas definitively lacks compared to an environment like Flash is any concept of object identity - once you draw out a shape, it's promptly forgotten and unavailable for things like mouse hit tests. This is what SVG is for I gather, and I hear that the original Processing environment has some of the same limitations.
One thing I've also found is that the current implementations of this technology are complete CPU hogs, as measured by the readiness of my Macbook to kick its cooling fan into high gear - canvas-only interfaces like Ask Ken devour cycles.
I certainly believe it's a possible improvement over the interaction model of the current state-of-the-art in online map warping, Schuyler Erle and Tim Waters's New York Public Library Map Rectifier. God bless those guys but the modal interface with server round-trip for retrieving a preview can get a bit clumsy.
I'm fervently hoping that an approach like this triangulated mesh can bump the interactiveness and usability of the NYPL map project, whose output could be so incredibly useful to an old map collection.
More broadly, I'm finding that the plugin-free development route might be a good one to pursue for real, mature interactive work. The rendering engines behind Safari and Firefox and becoming ubiquitous on desktop and mobile devices, and if you're willing to ignore the increasingly-irrelevant Internet Explorer and the occasional cooling fan overdrive you should be golden. Tom uses an informal measurement of the number of animated objects an environment can simultaneously throw at a screen, and canvas is definitively catching up to Flash quickly, while retaining the critical benefit of a fast, seamless start, something that Java has always lacked.
Oct 23, 2009 4:13pm
comments and markdown
The comments on Jeff Atwood's complaint about how site commenters don't read instructions are pretty interesting. Basic gist is that Jeff thinks users are dumb for not understanding how to format their comments according to Markdown rules, while his readers think Jeff is dumb for introducing new rules to a simple text box.
I poked around in the CSS2 spec and found a simple answer, "white-space: pre-wrap;".
This value prevents user agents from collapsing sequences of white space. Lines are broken at newlines in the source, at occurrences of "\A" in generated content, and as necessary to fill line boxes.
That one thing on output plus automatic conversion of URLs into links should make prety much all of Markdown and other similar text-flavoring tricks unnecessary. Indentation, line-breaks, ASCII lists, all that stuff is simply preserved just like it's been in plain old email for a million years. I converted the comments on this page to use it, curious to see if it does the thing.
Oct 22, 2009 12:41am
i18n like a l10n in zion
Wil Shipley's recent rundown of software localization reminds me that I've been getting a heaping helping of translation assistance from users of Walking Papers, resulting in near-complete localizations of the site in seven languages.
![]()
I write the English content, Jonas Kruckel does the German, Milo van der Linden the Dutch, Jonathan Fretin the French, Manuel Gonzalez Noriega the Spanish, Hiroshi Miura the Japanese, and now Emanuel Carnevale the Italian.
Wil offers a wealth of technical detail on the production of translations, some of which is directly applicable here. The most important worry is synchronization, and the biggest potential hurdle is requiring too much coding effort and knowledge from translators:
XIBs are like source code: they are written by programmers and contain functional parts. If your localizers happen to delete a button, or disconnect a binding, your program stops working for that language. Remember, your localizers are NOT coders - they don't have the same innate fear of changing XIBs that you've learned from years of boning yourself. And how fun is it to debug a program that works differently in different languages? Not fun.
I have this same worry about offering the site up for translation, but thankfully a number of people who can code and know a bit of Git have stepped up and volunteered. I use the Smarty PHP template engine for all the world-facing HTML bits of the site, so generally speaking a translation of the complete website can be accomplished by simply copying a directory of templates and replacing all the English bits with your own language. Here, for example, is the German version of the About page, in contrast to the Japanese version. There are some fiddly bits, though, in the shared templates where it's really important for all of the languages to be synchronized with each other, such as the main top-level navigation links. Even fiddlier is the scan page, where a somewhat complex set of conditionals in the HTML display competes with an orthogonal set of conditionals for bits of language, button labels, that sort of thing. I've though about pulling all these words into an external strings file, but the interleaving of template, HTML, and language makes for a lot of levels of misdirection and potential confusion. Wil again:
... many languages are not as compact as English: the French and Germans are particularly fond of using the descriptions with the lots of the words or compoundwordstodescribeasingleconcept, respectively.
On balance, I think I'd prefer for this process to be tedious if that makes it more easy to see where the points of coordination need to be.
The unsung hero in this process has been Git and more specifically Github, the revision management tool and hosting site I've chosen for Walking Papers. Git has opened up a really interesting dynamic, where some of the more recent translations (Japanese, Italian, Spanish) were done without my knowledge or permission, and offered as a pull request. Emanuel Carnevale did all his translations in the space of a day or two, and let me know when he was finished. This kind of cooperative, loosely-structured development is a dream - translators can do the work and offer it in a completed form, instead of the usual offer / negotiation back and forth that might be necessary with a non-distributed hosting arrangement.
I've screen-capped the entire Git network graph here, to show how Git understand's these parallels split, development, and merging streams (it's on its side, because it's very long):

Oct 9, 2009 4:52am
the other shoe drops
Wow, check this out:

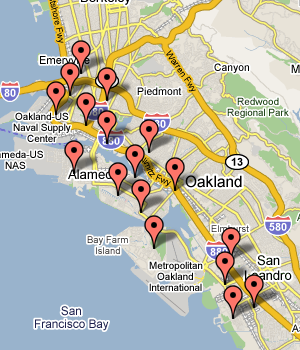
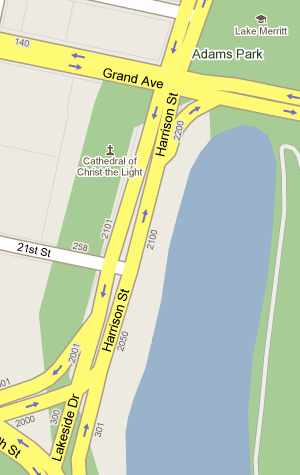
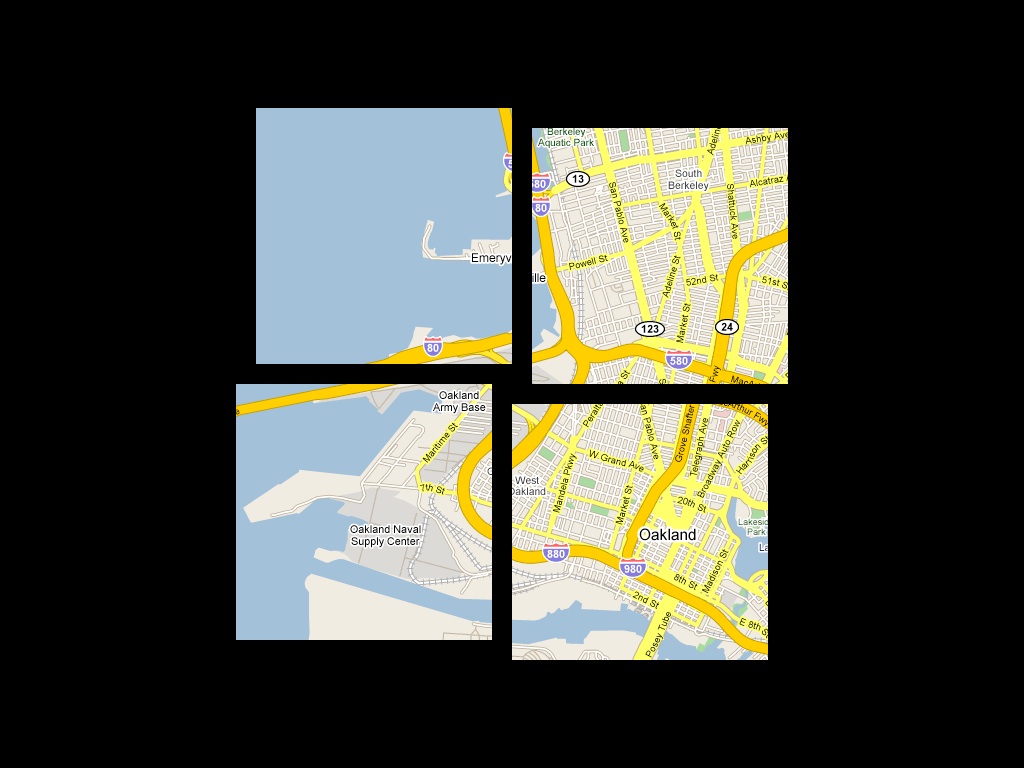
What's missing? "Map data copyright 2009 Google" - no TeleAtlas, NavTEQ, etc. Looks like all that street view driving finally paid off for something besides just photos of people picking their noses. I've long used the park above (Oakland's Middle Harbor Park) as a canary when checking up on major map provider's data. Most providers still use the coastline from before the army base moved out and the area was turned back into a wetland, and they also don't seem to be aware that this park exists. Google now has correct, new data overlaid on bad, out-of-date coastlines. You can see mismatches all over the place while this transitional period is underway.
This is how the area looks in reality:
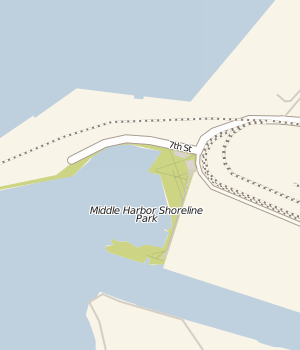
Some of their data is now outrageously wrong:
I'm guessing this has something to do with the newly-hatched "report a problem" feature.
Oct 9, 2009 4:12am
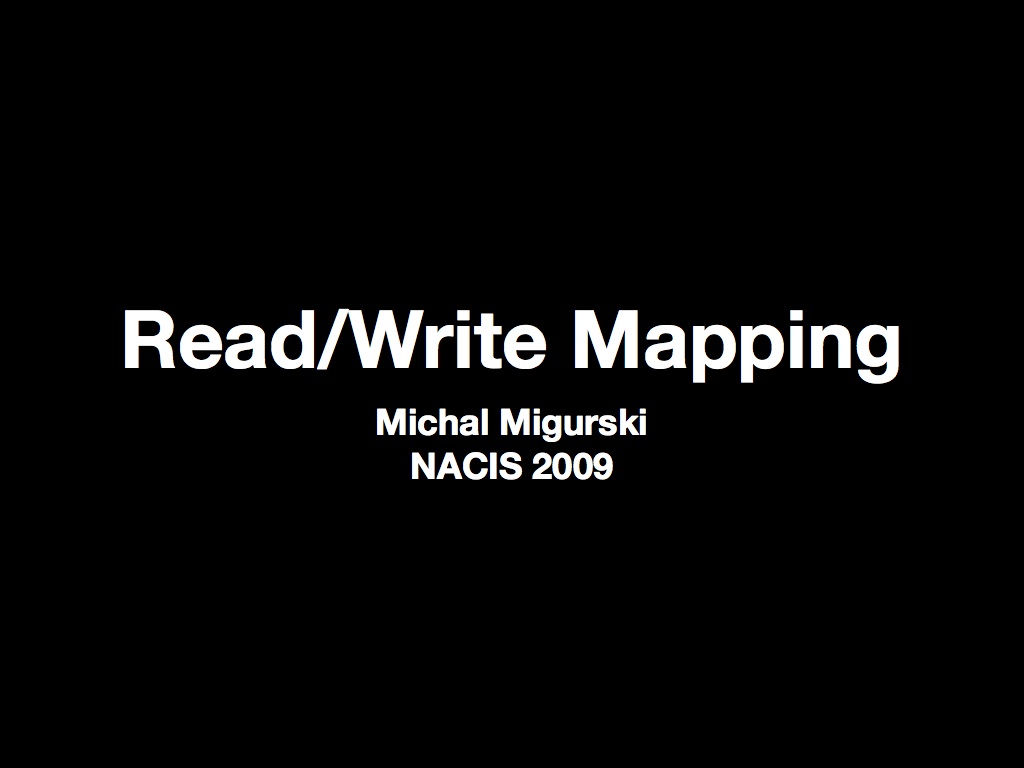
read-write mapping
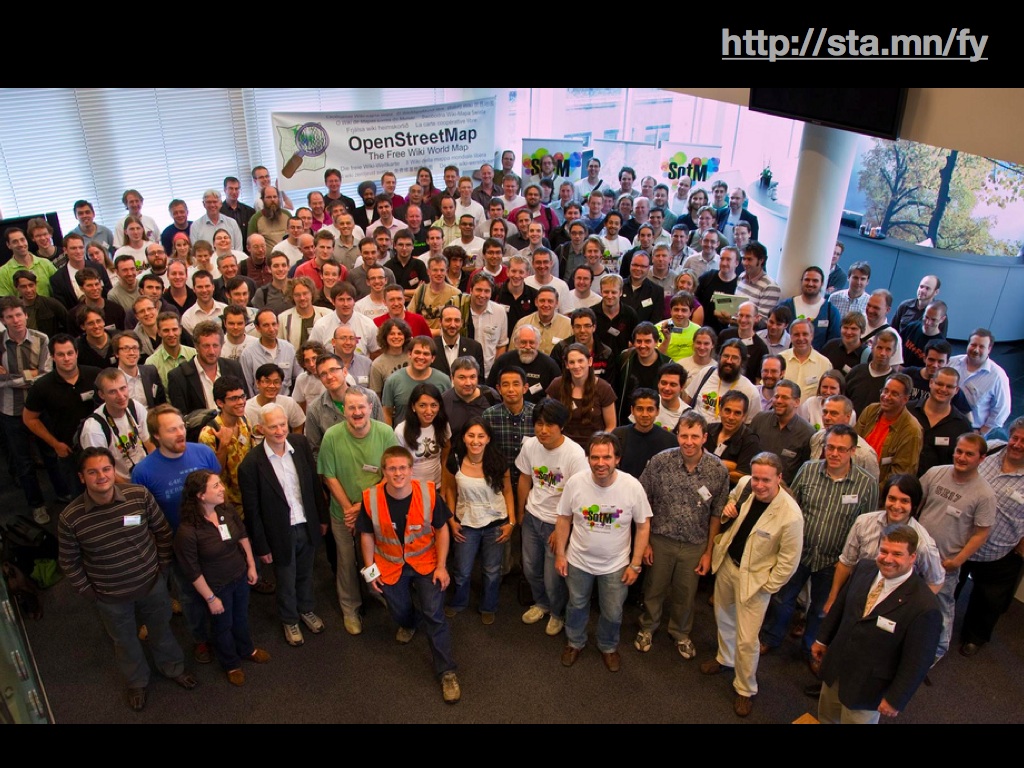
NACIS, the North American Cartographic Information Society, was kind enough to invite me to deliver the keynote for their annual conference yesterday.
What. A. Thrill.
I used the opportunity to talk about the fascinating OpenStreetMap project, specifically the ways in which it's useful to a cartography audience and how that audience could benefit the project. This last thing in particular is what I closed with: I think the online face of OSM's rendered tiles could use serious input from the NACIS community, particularly at the kinds of medium scales where the highly-detailed data blurs into "features". Much of this happens by-hand in tools like Adobe Illustrator from what I can tell, a very different workflow from the industrial automation offered by my favorite stand-by, Mapnik.
It was an excellent group, as enthused about maps as I am, composed of working cartographers and map librarians. It was a chance to meet some folks that I've been following online for ages and dork out about maps for two days. The conference is still going, sadly I had to return to the mission for friday work.
One thing I experimented with a bit in this talk was the use of on-screen shortened URL's, which I hoped might make it easier for audience members to note anything of interest while the slides rolled by. Also, although I wrote and printed everything below, the talk itself was a bit more loosely structured, since I'm terrible at paying attention to people and paper at the same time.
Anyway.
This is a talk about a new awareness of maps and geography, and a change in attitudes toward maps.

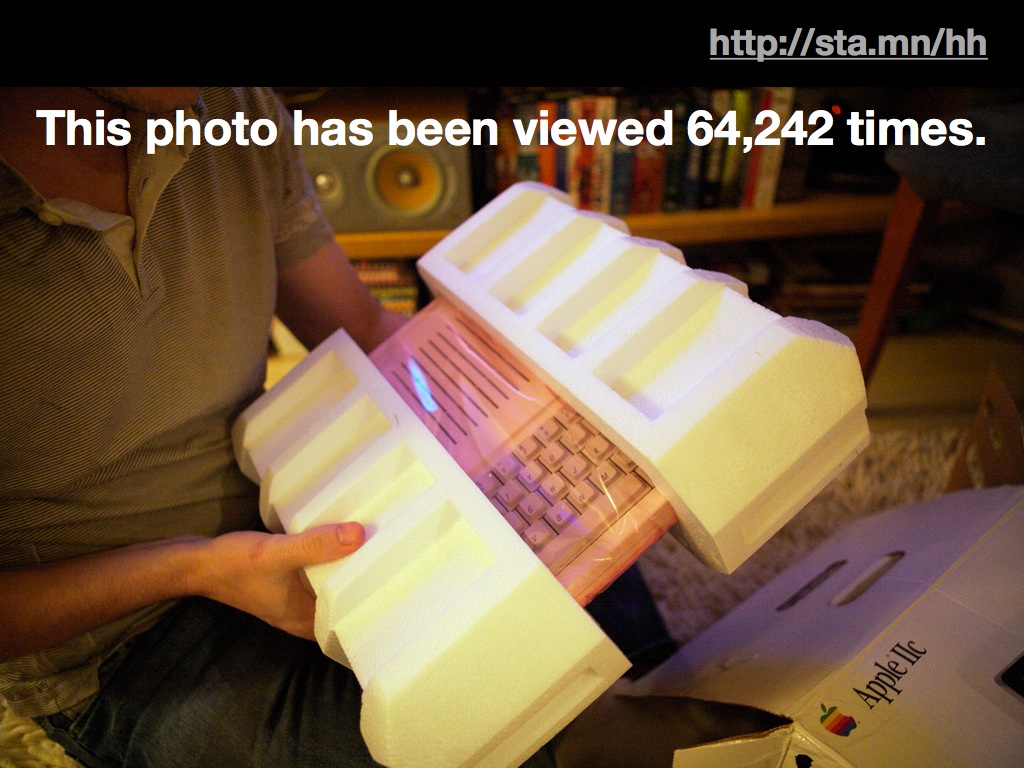
I'm going start with a small detour here to tell you about an online phenomenon that's going on four or so years now, called Unboxing. Unboxing is a kind of geek striptease, described in one site's tagline as a "vicarious thrill from opening new gear".

Unboxing is a response to the meticulous packaging of modern electronics gear, most notably Apple's range of iPods, iPhones, and Mac computers - careful design is invested in the packaging, and careful appreciation is invested in its removal.
Why unboxing? Two aspects of the trend seem relevant here.
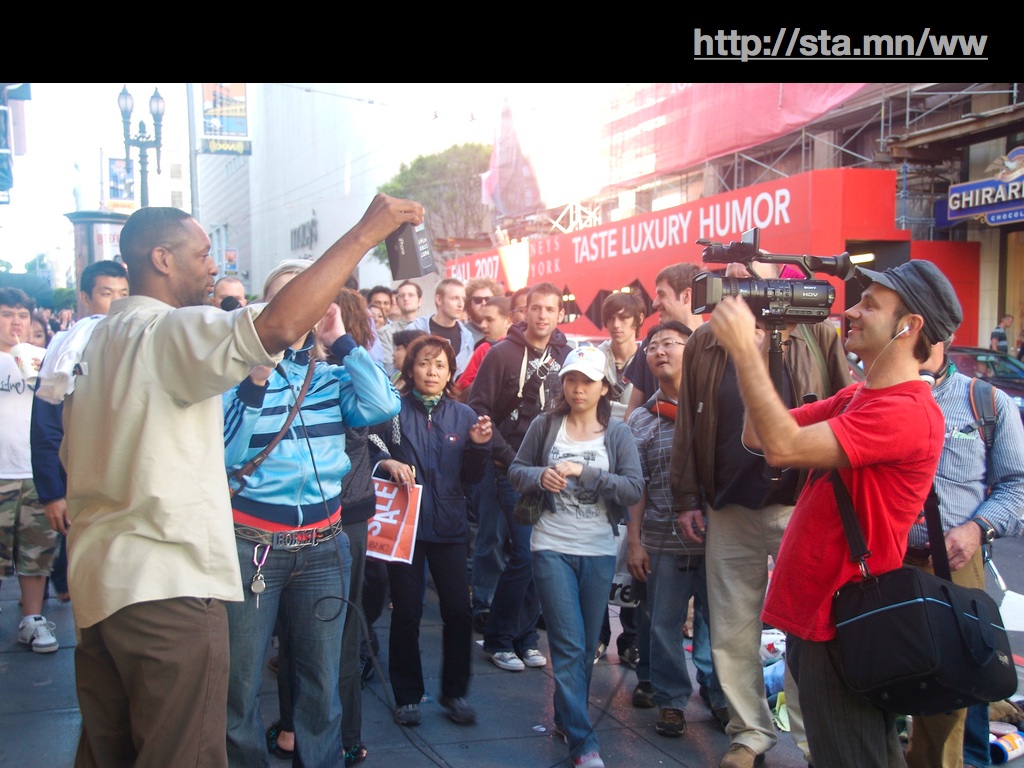
First, it's a new kind of visibility into the fan club culture around popular electronics, allowing users to elevate their own appreciation of a mass-market good into a social experience. I remember bicycling past the Apple Store and the Cingular store on San Francisco's Market St. on the day the iPhone was released. There were enormous lines in front of each, and as customers picked up their new iPhones they'd walk out the door, break into a jog, and high-five the remainder of the line. The division between fan and star here evaporates.
Second, the delivery mechanism for this fan-produced culture tends to be online sharing sites like Flickr and YouTube. Both are examples of the phenomenon of the "Read Write Web", the now-familiar pattern of web-based communities formed around the creation and sharing of social objects like photos and videos.

One effect of these online communities is a new and durable awareness of the process behind creative production. Pages on Flickr or YouTube follow a pattern you're probably familiar with: title in the upper-left, main "thing" just below that, and to the right at the same level of importance, the person who made it for you. Responsibility and provenance along with all the messiness and point-of-view are built-in assumptions.
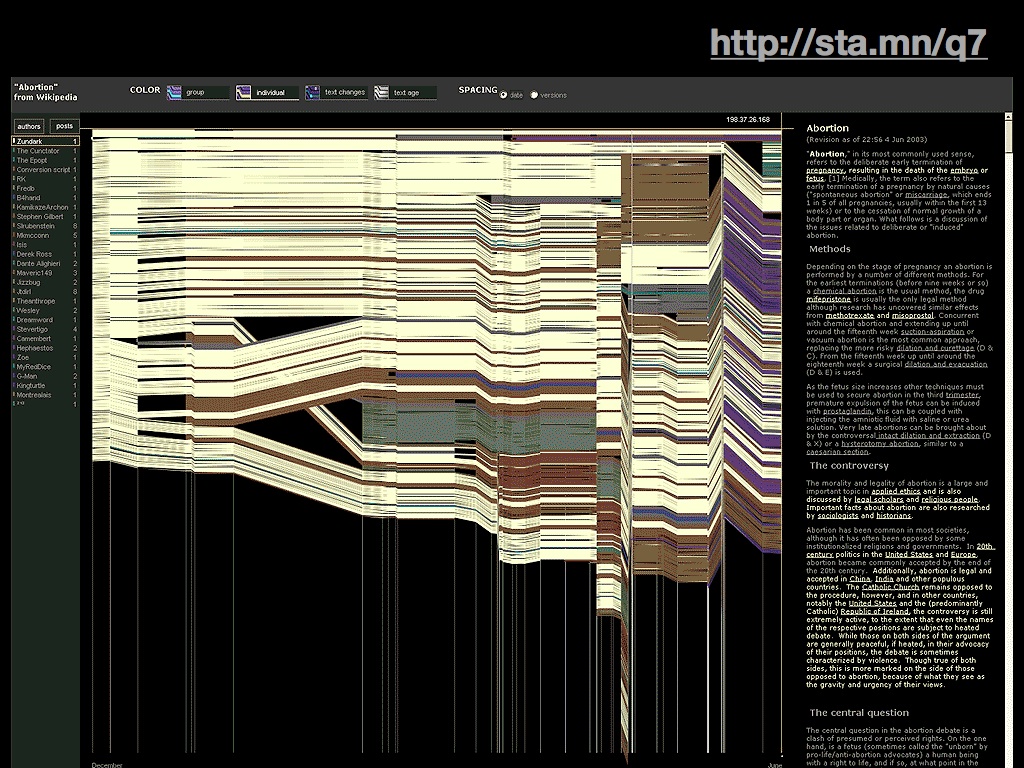
In the world of text, we see this same pattern on Wikipedia.
This is the History Flow project from Martin Wattenberg and Fernanda Viegas at IBM, which shows edits to a single Wikipedia article over time as threads and contributions from a group of editors.
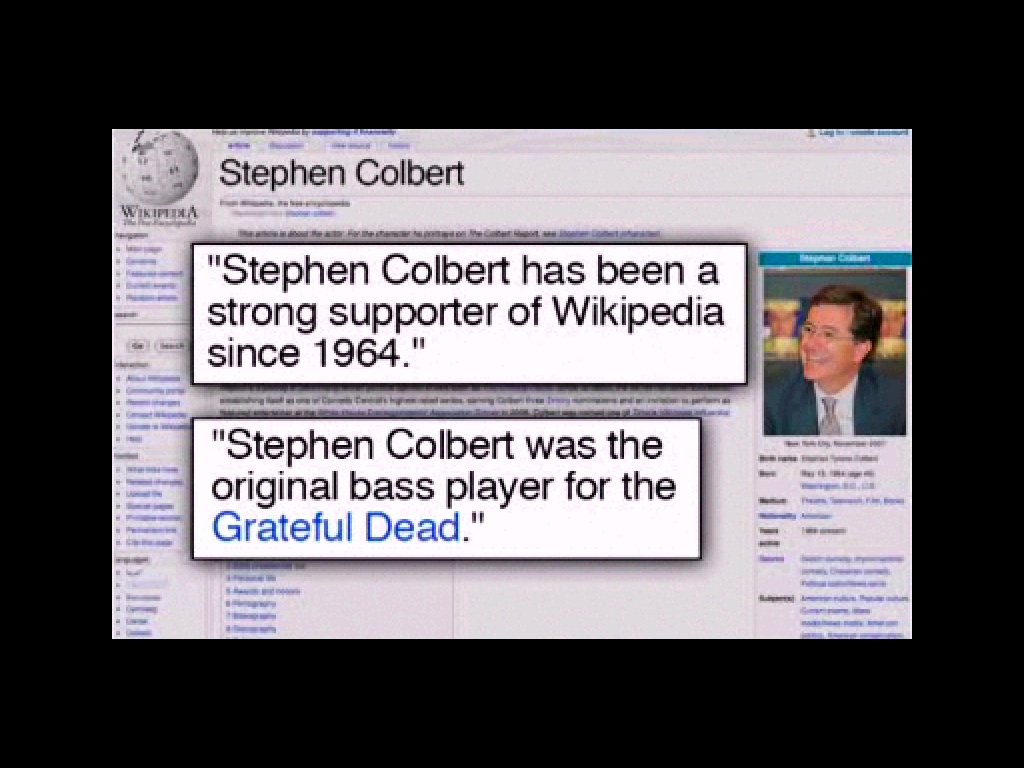
Like this one, each article has been beaten into shape over time by a group of people following loose rules of cooperation, so each page has an associated "Talk" page where you can peek into the arguments and negotiations connected to the particular set of facts represented there. You can see the sausage being made. You can also cause the sausage to be made, as we saw with Stephen Colbert's parody of consensual reality he called "wikiality" and used to make occasional, abusive, hilarious forays into Wikipedia.
This is where we segue into geography.
Around 2004 or so, UK developer Steve Coast started a project called OpenStreetMap, the Wiki world map. Steve was connecting a few emerging threads: the falling cost of GPS hardware since it was made available for civilian use in 1996, the dismal copyright layer wrapped around Ordnance Survey maps, and the lack of a viable crappy-but-free alternative in the UK. It's hard to overstate how crazy this idea was at the time; everyone knows that collecting worldwide geographic data at the street level is a massive undertaking, out of reach of an enthusiast community like the OSM of the time.
What was the state of online mapping at the time? Not terrible, but not great.

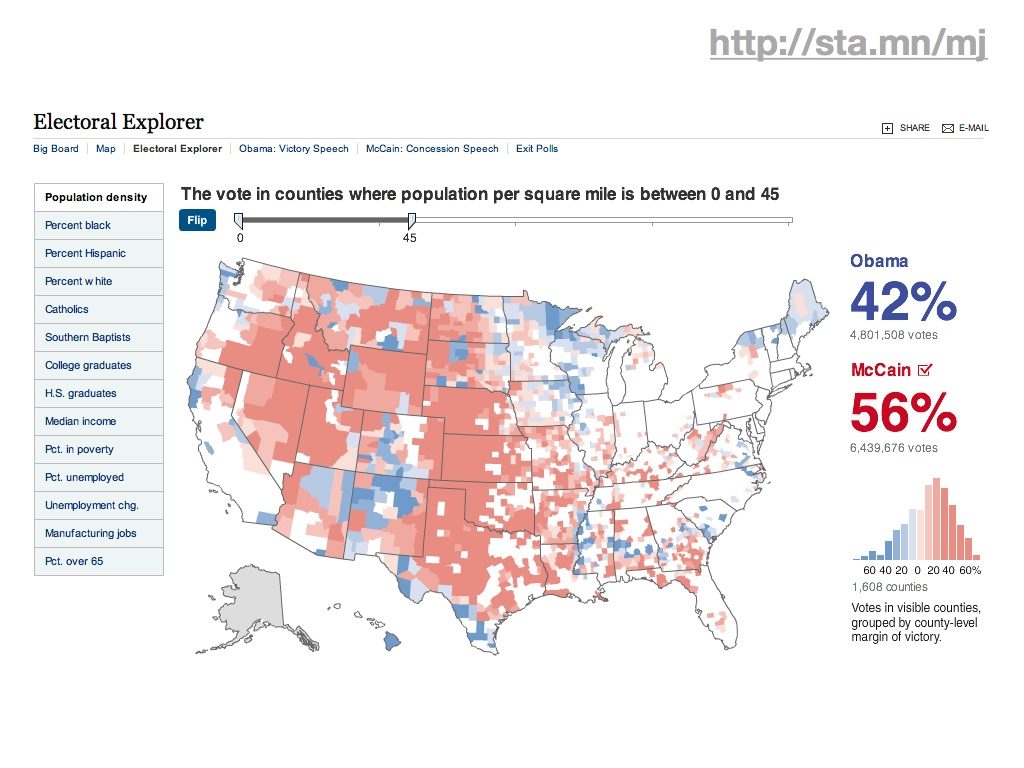
The National Atlas, among other sites, makes administrative boundary data freely available. It makes possible projects like these election maps from the New York Times, which surface county boundaries and election results in a dynamic, interactive context.

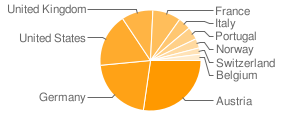
Using data like this, we made an early Stamen project, Mappr. Mappr was an early attempt at applying geography to images on Flickr, and the only information we had to go on in 2004 was a loose match on town and state names. I didn't know a thing about shapefiles and only a bit about projections, so I started with a bitmap of the lower 48 and created this simple Flash-based map of the United States. It lacked any details other than borders, but this paltry context was enough to clearly communicate the loose geographic placement of Flickr photos on the basis of tags.

We took that same codebase and applied it to the MoveOn Virtual Town Hall in summer of 2004, where it was possible to see yourself and 50,000 other live participants in an interactive geographic setting. Again it lacked towns or roads, but the presence of the people themselves was enough to place the whole event in context.
Early the following year, Google released their Maps product, which introduced pervasive, available, beautiful road cartography in an interactive package we had never seen before. We think of this as a sort of Year Zero in online mapping.
Two things resulted from this release: every website that could possibly justify the inclusion of a map started using Google's, and normal web users' expectations around online cartography reanchored themselves to Google's design decisions around tiled delivery, road display, and coloring. We moved from the primitive aerial imagery of TerraServer, to a much more advanced kind of cartography. We also brought on the specter of what Schuyler Erle calls "red dot fever" - the profusion of pin maps with the context obscured by the data in front.
Mappr and MoveOn both immediately scrolled into the past to be replaced by the iridescent oranges and greens of Google Maps. I think there's something a bit unfortunate about this switch, but then again we're currently in the middle of a new transition where over half of all online map usage is taking place specifically on the iPhone, where the desktop visual design of Google Maps may or may not prove to be appropriate in the long term.
So it's 2009, and OpenStreetMap has attained a level of completeness long believed impossible through a slow, stubborn process of piecemeal growth punctuated by massive donations of raw data. The project is run along many of the same lines as Wikipedia: you can see who's added what data, choice of what's worthy of inclusion is left to the volunteer community, and the end result is covered by a license that emphasizes freedom over all else: Creative Commons for OSM, GNU Free Documentation License for Wikipedia. The social model around this kind of co-creation has been described by programmer Brian Marick as "artisinal retro-futurism and team-scale anarcho-syndicalism".

Why has the project been so successful? It is rooted in the Four Essential Freedoms of open source software identified by Richard Stallman: the freedom to use, study, share, and change. Stallman numbers them starting from zero because he is a programmer. It's worth noting here that the bugaboo of the so-called viral license is mostly a paper tiger. Share-alike licenses like those used by OSM and Wikipedia grant you new rights you wouldn't otherwise have, and ask for their continuation as a form of payment - as these licenses become the norm rather than the exception, they will cease to be controversial.
Currently, they're a pre-requisite and necessary motivator for taking advantage of what Clay Shirky has called a "cognitive surplus".
OpenStreetMap is also a generative system, welcoming unanticipated innovation.
Jonathan Zittrain identified five characteristics of generative systems that are relevant to OpenStreetMap: "(1) how extensively a system or technology leverages a set of possible tasks; (2) how well it can be adapted to a range of tasks; (3) how easily new contributors can master it; (4) how accessible it is to those ready and able to build on it; and (5) how transferable any changes are to others—including (and perhaps especially) nonexperts."
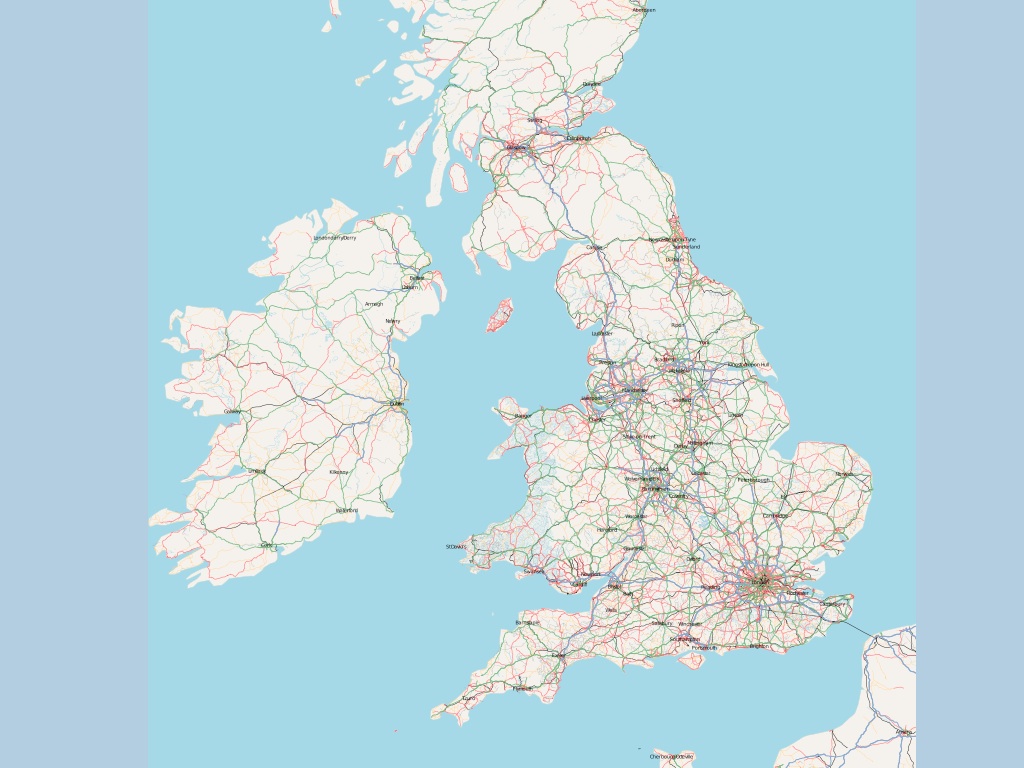
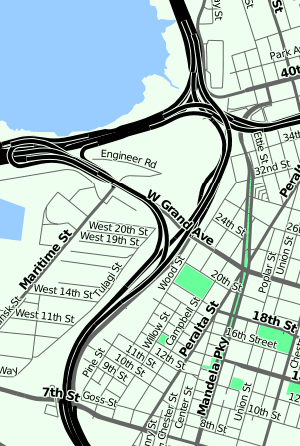
A few of these are directly applicable to this audience. The data in OSM is can be directly used to create beautiful city-scale maps for many metropolitan areas, today. Here are a few projects that we and others have created using OpenStreetMap data as a base.
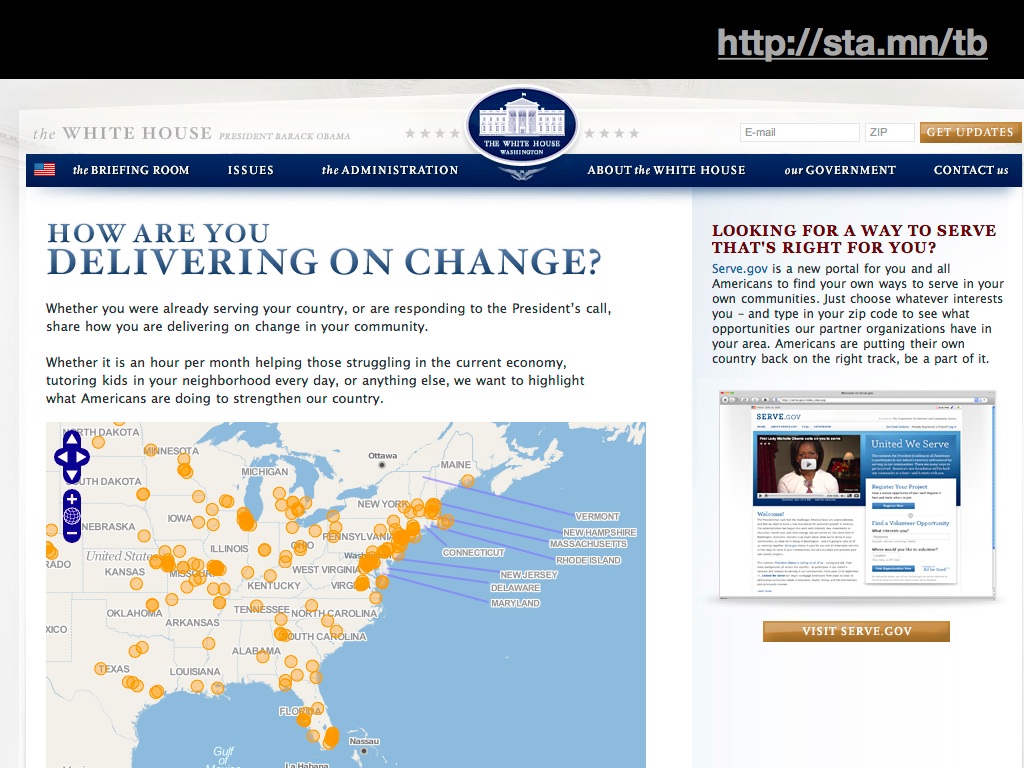
White House: how much more legitimate can things get?
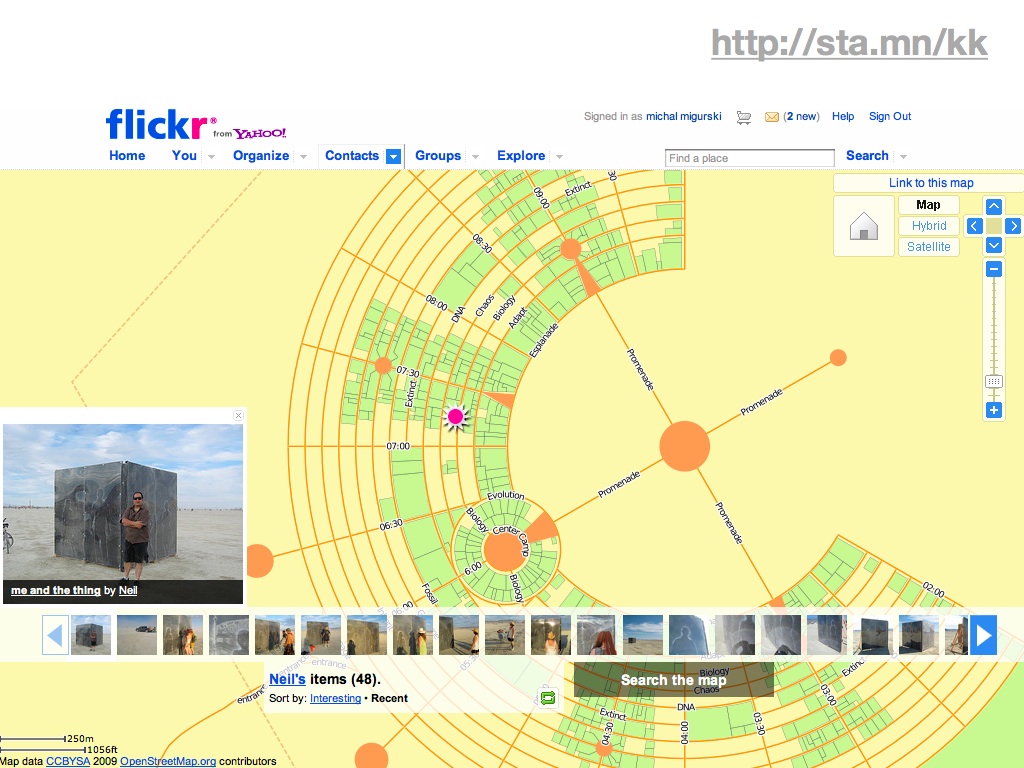
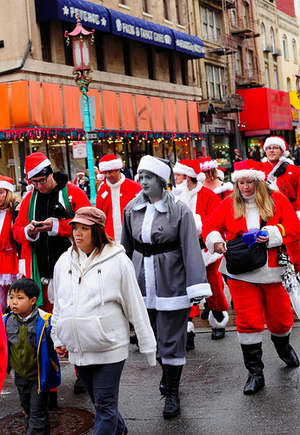
Flickr world cities: providing context in moving places like Black Rock City and underserved places like Tehran.
Cloudmade Style Editor, Stamen styles, Lynchian_mid: placing the tools to perform basic worldwide cartography edits in the hands of web people.
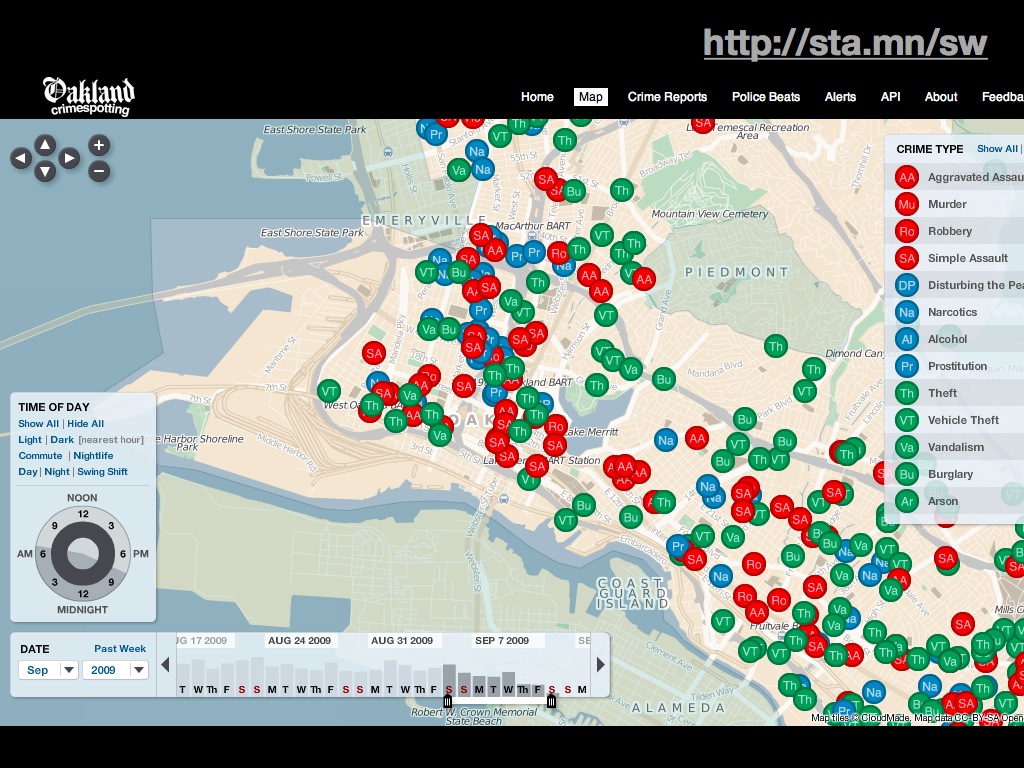
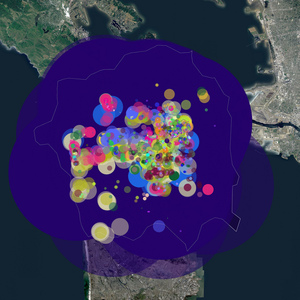
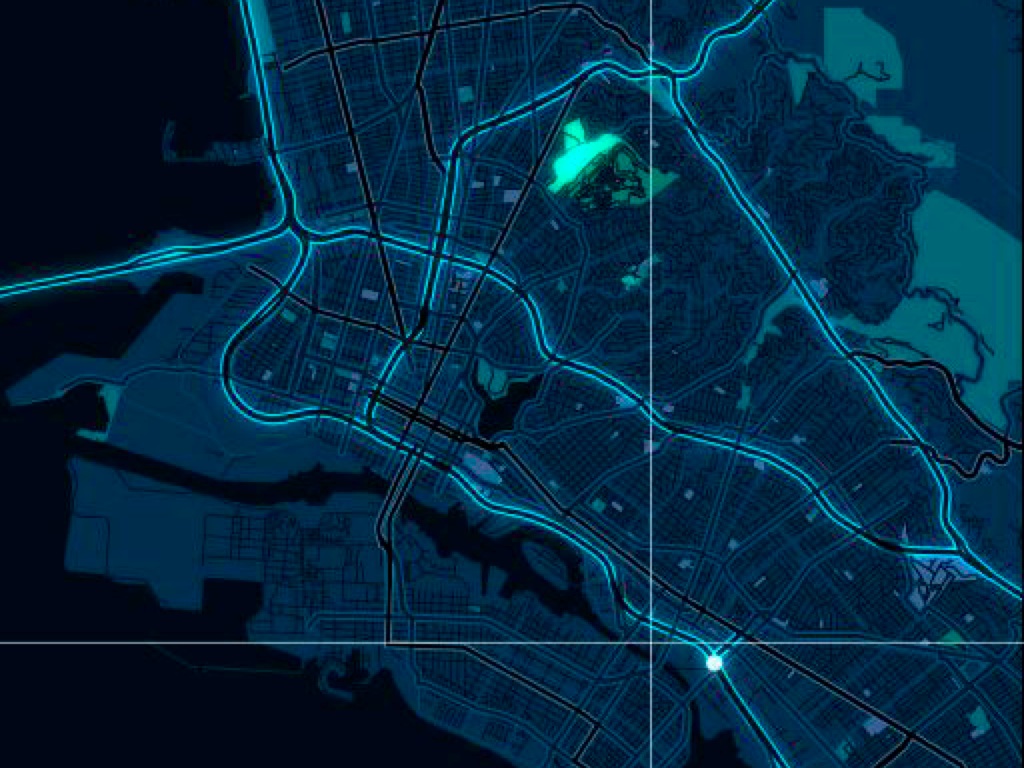
Oakland & SF Crimespotting: Pale Dawn was in some ways designed specifically with Crimespotting in mind, and SF accepted OSM's use in its "app store" uncritically.
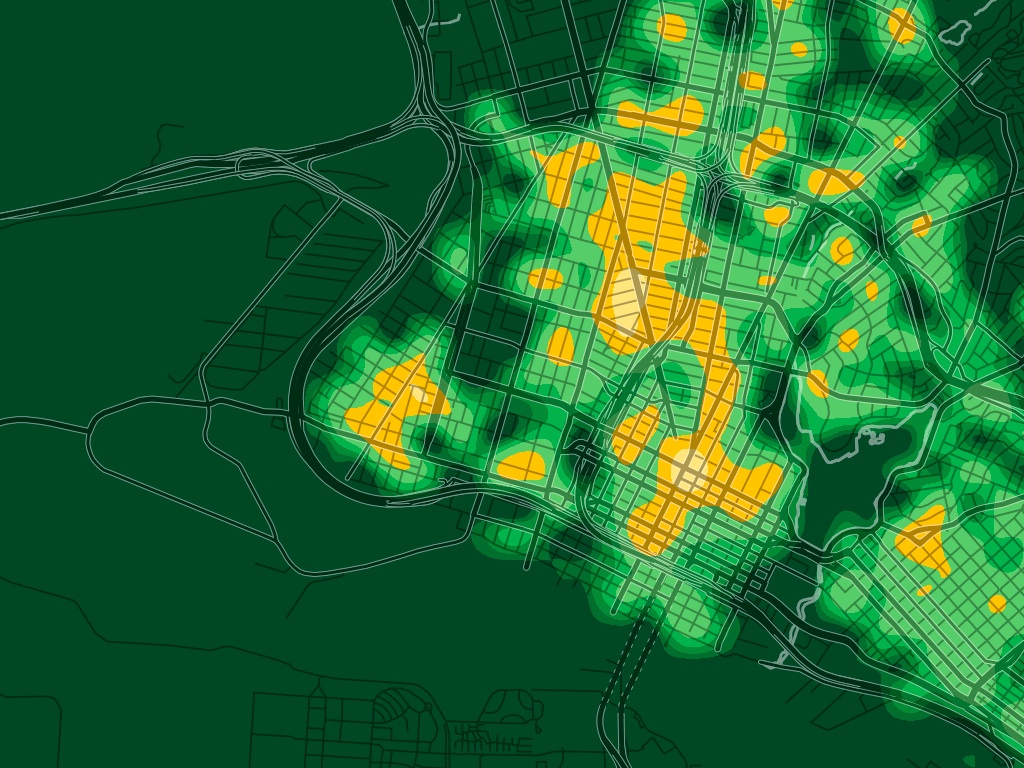
Crime heat maps show how the data can be presented in new ways in you have the vector data to work with.
The data in OSM is large with great coverage, and it's also available for you to change.
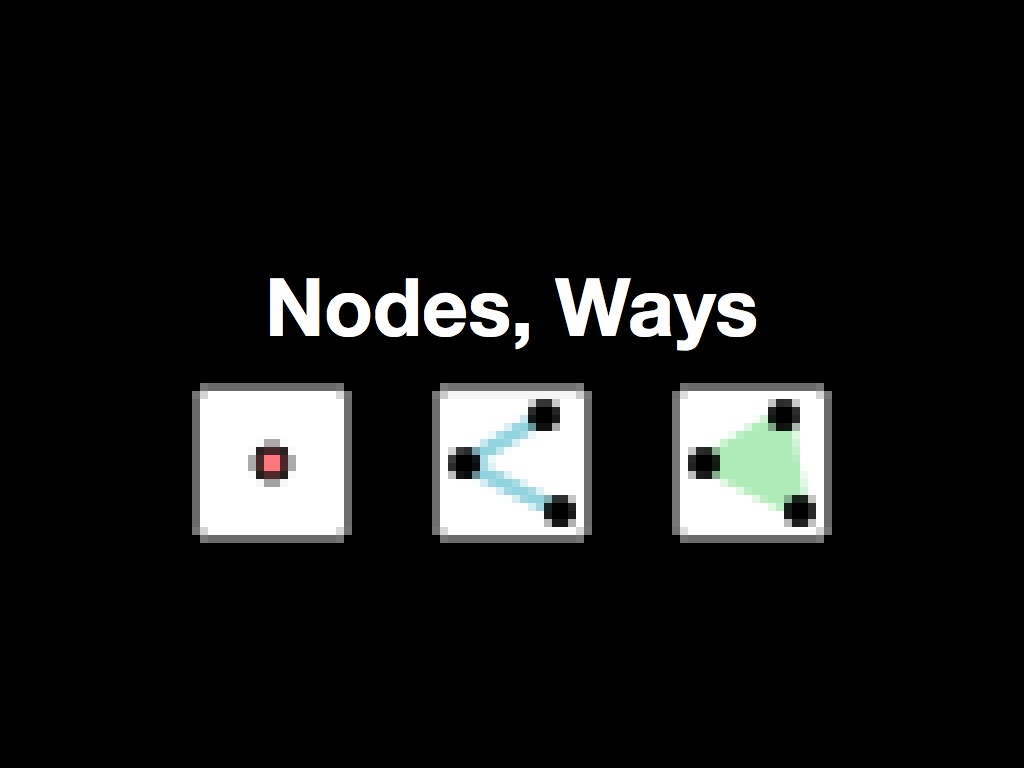
The model is incredibly simple. There are nodes: simple points with a and latitude, longitude. There are ways: lines made out of nodes, one after another, sometimes closing a loop to form an area. Finally, there are tags, where the real negotiation takes places. OSM's official stance on tags is that "you can use any tags you like as long as the values are verifiable. However, there is a benefit in agreeing to a recommended set of features and corresponding tags." This is an opportunity big enough to drive a truck through: commonly-used tags for road types share space with rare and esoteric tags often limited to specific individuals or groups. The tags are what make OSM generative.
Here are a few projects that use OSM's tag structure to create something new.
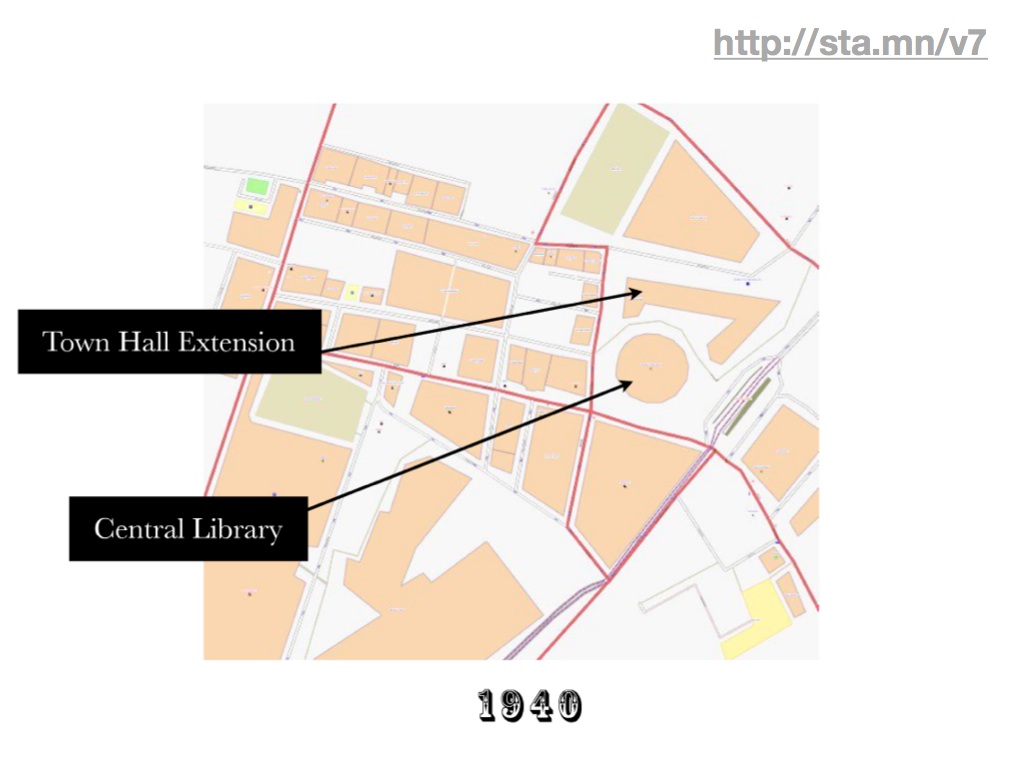
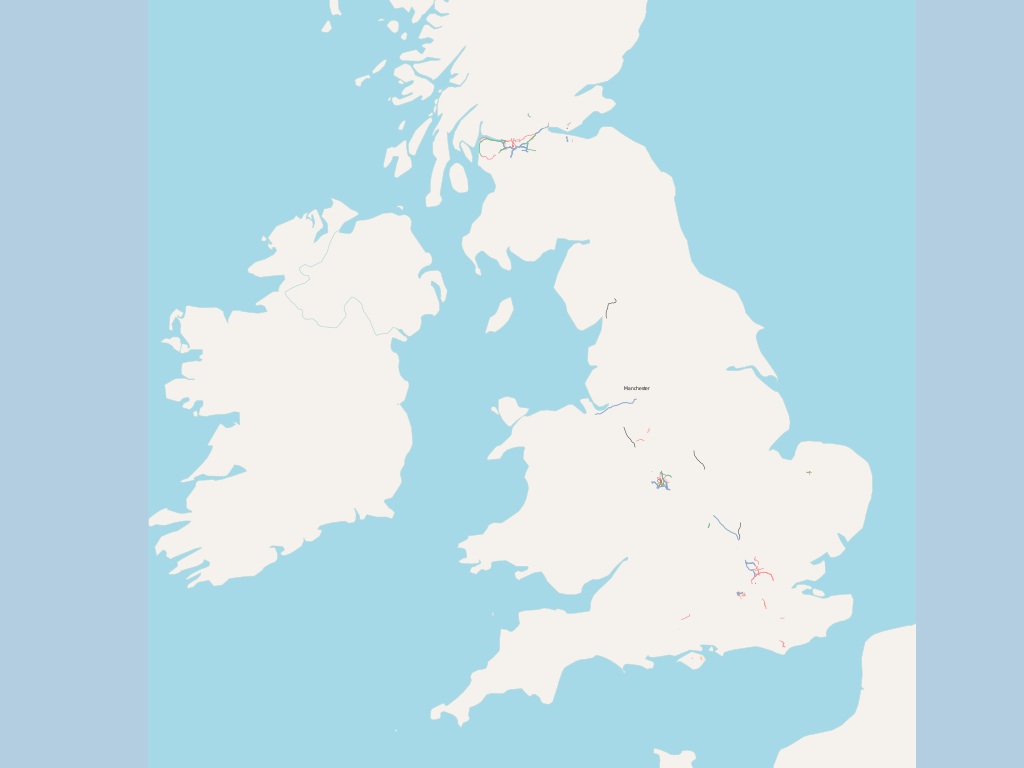
Frankie Roberto's historical date tags offer the promise of temporal coverage by including "start_date" and "end_date" tags on buildings in his native Manchester.
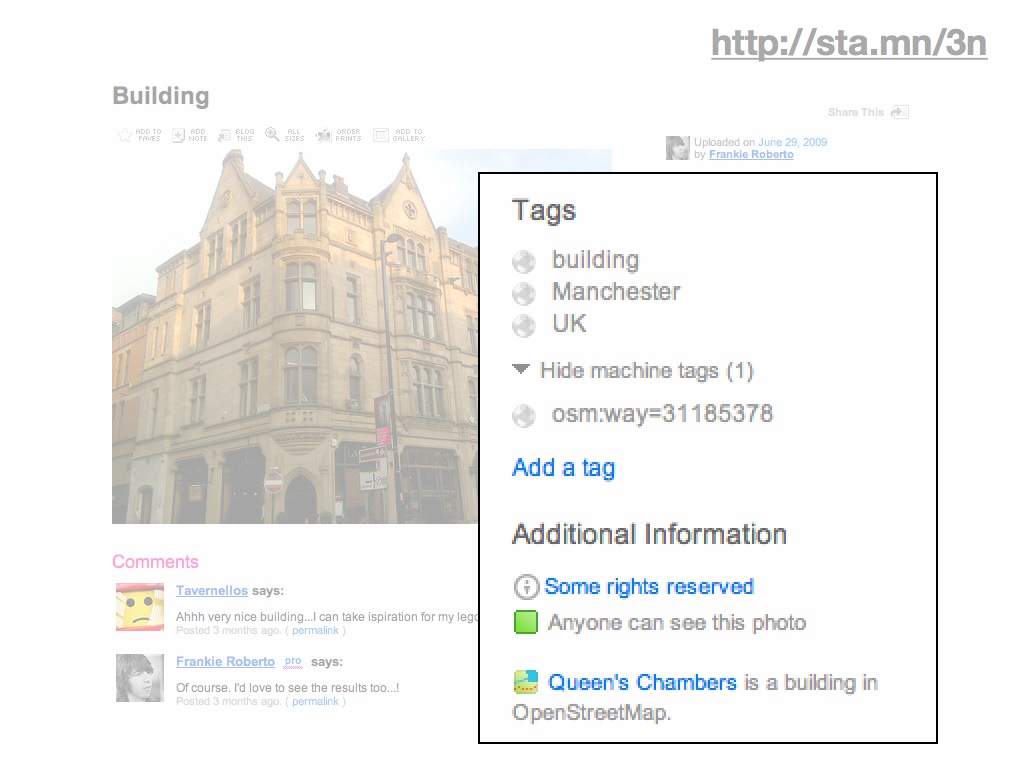
Flickr's new found machine tag support for OSM ways is gracing items like Frankie's photograph of this historical site.
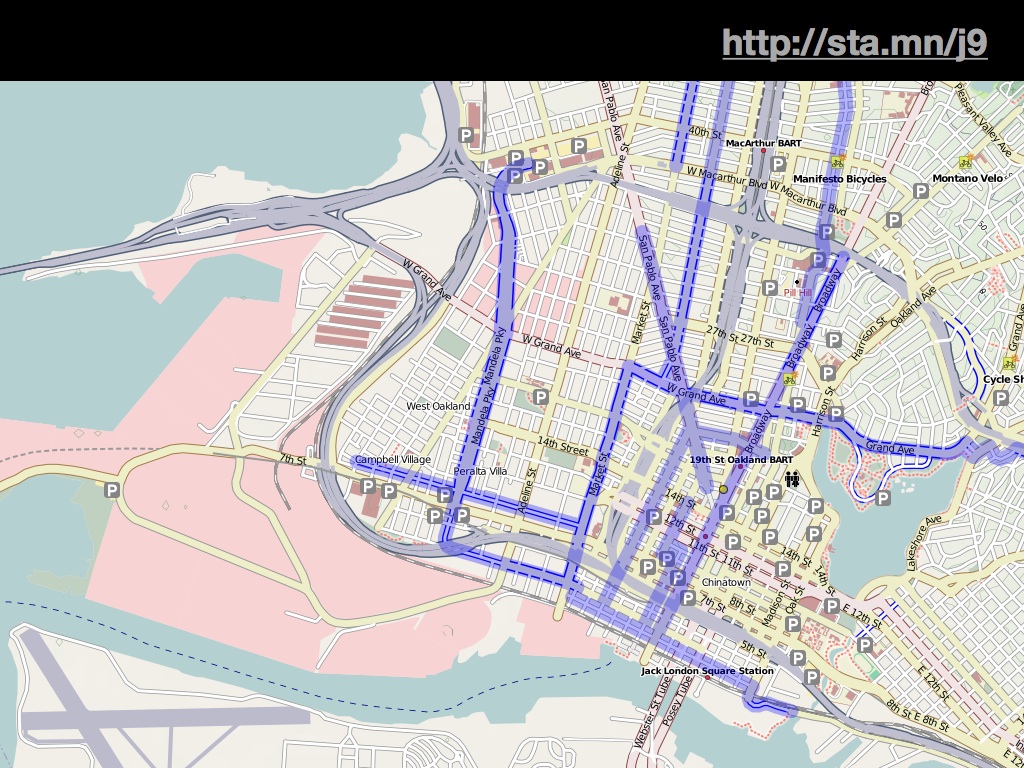
Andy Allan's OpenCycleMap won an honest-to-goodness cartography award, for being one of the first major designed projects connected to OpenStreetMap.
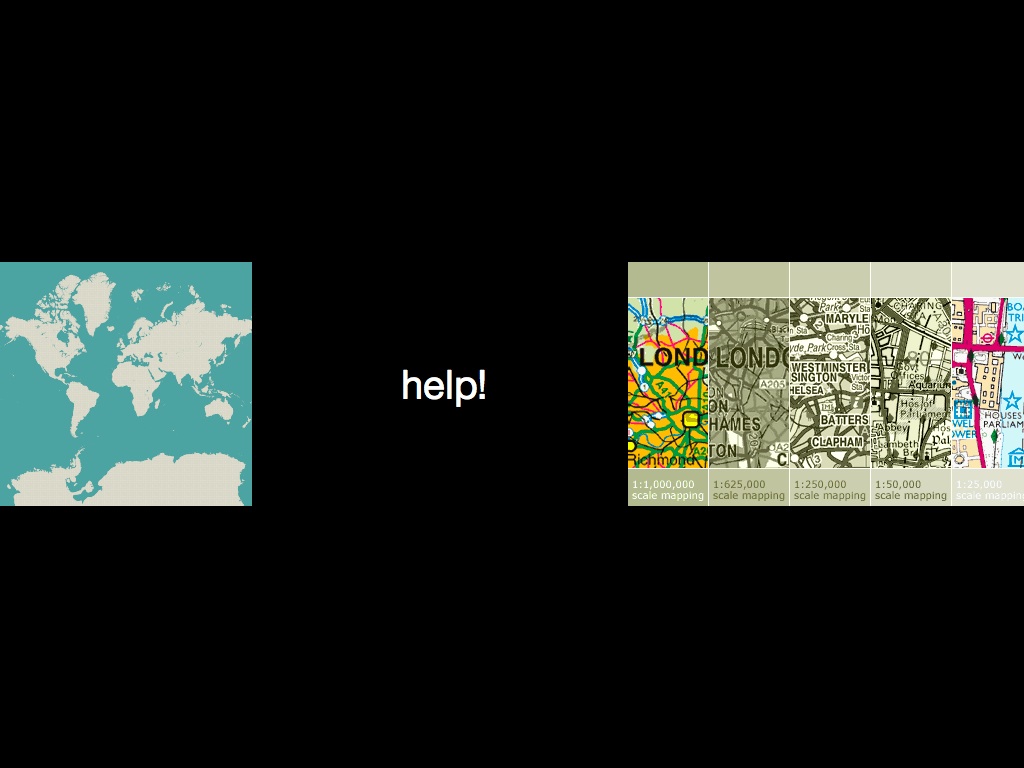
The model is also incredibly primitive, from the point of view of good cartography. This is where everyone in this room comes into play. We know from the data-gathering methods used by OSM - GPS, Walking Papers, neighborhood parties - that the primary focus of the project is on the city and street scale, where details like post boxes and bicycle lanes make a difference. We also know, thanks to the efforts of the USGS and Natural Earth, that small scale map data is available for unrestricted use. What's missing from this picture is a hole in the middle: a space between the 1:10,000,000 and 1:250,000 or so scales where motorways, parks, towns, and administrative boundaries are important, but currently stored at an excessive level of detail in a project like OSM.
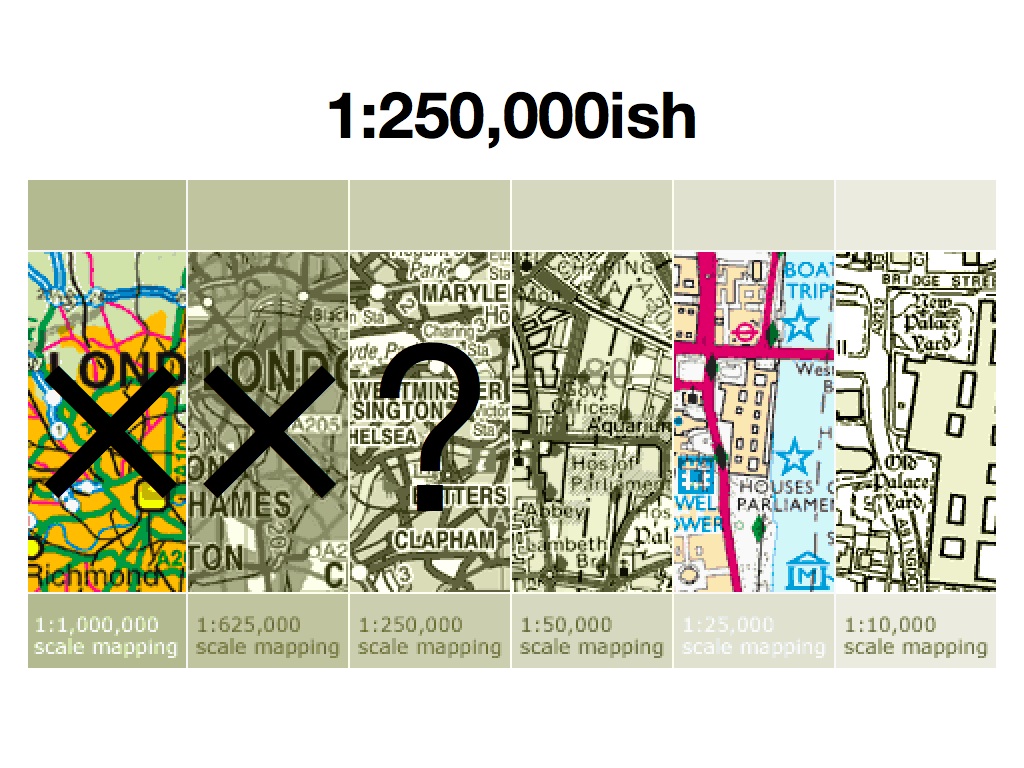
According to Oakland's Lohnes Wright, a feature like a river becomes "something different" when its best representation transforms from the precise riverbanks of OSM to the more general line of a statewide map. How might it be possible to bridge this gap in today's open data world?
More generally, how can thoughtful, correct cartography best be applied to today's online maps? Most digital rendering packages that can operate at the worldwide scale are fairly primitive sets of rules and filters, and can't currently handle the kinds of fluid, responsive placement and drawing decisions necessary for really good maps. They're being built largely by engineers interested in solving engineering problems, the same kinds of people who invented HTML and the world wide web as a vehicle for the efficient delivery of physics papers. It took ten years of experimentation and negotiation to transition to today's online design environment that respects the meaning of the written content and its visual presentation equally.
If there are three specific things I'm interested in conveying today, it is that open data is here for you to use, safe for you to use, and in need of your help.
Oct 7, 2009 11:06pm
breaking links
Quick pet peeve break.
I use tabs in my web browser, a lot. I especially use them in combination with my keyboard so that I can open links in new tabs: command-click in Safari means "open this link in a new tab". It lets me rack things up in the background without breaking my reading flow. This works for all normal links on the web.
It is a unique and special source of frustration to me when websites fuck about with Ajax and inadvertently break completely normal features of the web like this one. As far as I can tell, the idea is to offer regular HTML links, but introduce a javascript callback which changes them to a redirection at the moment that they are clicked. Looks like a link, but does not act like a link. Adam Greenfield writes about the potential future suckage of ubiquitous computing in just these terms: the addition of superfluous, unexpected behaviors to otherwise regular objects that no doubt seem like delight in the lab, but translate to frustration in the regular world.
Unwelcome magic.
For a long time, I thought it was just Twitter pulling this kind of thing (ask my coworkers about my occasional "fuck twitter and their stupid fucking fuck website" outbursts in the office), but recently I've started to see it being used on Wordpress blogs, even ones that aren't visibly hosted on a wordpress.com domain. I'd be a lot happier with my browsing if I didn't have to play guessing games before clicking on things - "is this a link or not a link?"
To see this behavior in action, check out the latest from Matt Jones and try to get the browser to open those links in a new tab with a command-click. It doesn't work because it needs a moment to jump you to "go2.wordpress.com".
Now back to your regularly scheduled lack of communication.
Sep 29, 2009 6:56am
openstreetmap genuine advantage
It should be obvious by now that I've got OpenStreetMap on the brain, and I'm not alone (though I hope I'm able to out-dork Flickr here).
Since we were involved in last month's DataSF launch, I've been thinking a bit about how an anarcho-syndicalist geo data project becomes useful to a city like San Francisco. Right now, we have two broad sets of free-enough SF streets data: the city's own shapefiles and OSM's excellent coverage. There's been a bit of effort expended on moving from the latter to the former; the OSM data itself is largely based on a mass import of the TIGER/Line set. What about movements from OSM to SF, and continued cross feeds between the two? At the launch party with the mayor, I asked whether the city had a plan in place to handle feedback and corrections on its data, which I think is absolutely critical for a mature data curation practice. Right now, I suspect that the DataSF centerlines file contains a large number of paper streets and a few long-since-demolished freeway overpasses.
A technical answer to this issue would address the need for a city to vouch for what it knows and verify changes made by others, as well as preserve the flexibility needed by editors of OpenStreetMap. Public key cryptography, the Right Answer No One Likes, has a feature called signing, where it's possible for the holder of a key to add a forgery-proof signature to a block of data. I've put together a small project called GOSM (Genuine OpenStreetMap) that automates the process of adding signatures to ways in the OSM database and stashing them in tags.
There are a few needs here that are worth thinking about.
First, it's likely that there are multiple overlapping constituencies for any given bit of geography: the city, the county, the state, neighborhood groups, commercial interests, etc. It should be possible for any or all of these groups to offer independent signatures on bits of geography that concern them.
Second, it's important to sign only the aspects of the geography that matter, and to do so in a way that's resistant to noisy changes. For example, a signature on a road that vouches for its name and classification should not be invalidated by the addition of a bike lane tag.
Third, it should be possible for the signing authority to publish a list of their own contributions for comparison or verification.
How do these come into play in GOSM? Using it is very simple, from the command line. Here we sign the highway, name, and oneway tags on two streets:
python sign.py -u (osm username) -p (osm password) -k (gpg key) -t highway,name,oneway 28518589 23969004 > out.txt
The signature is added to each way as a tag, called gosm:sig:8CBDE645 (that last bit is the key ID - there might be more than one). The value is a string that includes the requested tag names ("highway", etc.), a base64-encoded GPG signature, and a date+time. The signed message is not stored, but it's an encoding of the tag values and the geographic location of each node in the way that's easily derivable from the way itself. I use Bencode for the encoding because each value has one and only one possible encoding, and Geohash for the locations because Bencode doesn't like floating point numbers.
The important bit is that there can be many signatures on a way, one for each interested signing authority. I've signed a few streets I know, and a city could do the same with a good key.
Checking a signature is easy:
python verify.py -k 8CBDE645 28518589 23969004
How many people actually need to verify a signature? Probably not many; public key crypto is sort of a mathematician's backup to common sense. What happens when signatures are invalidated by later edits? I expect that a bit of common sense would apply here as well, with consumers of the data using investigation and judgement to decide whom to trust, and signing authorities keeping an eye on signatures. The outcome I think would be especially worthwhile would be if a city or county used a mechanism like this to determine when its own database fell out of date, and treated the new conflicting information as input rather than contradiction, signing subsequent versions of streets as OSM participants mark them with updates.
Aug 26, 2009 7:14am
tile drawer, round one
For better or worse, Mapnik has long had a reputation for being difficult to install. Ditto OSM planet dumps. I know and you know this is not true, but just because Dane has done so much work to drastically simplify the process doesn't mean you want to do it yourself, like how people stopped soldering their own MP3 players when the iPod came out.
Meanwhile, Amazon has a thing called EC2, the Elastic Compute Cloud, and it's amazing, really one of the biggest changes to my work as a technology/research/CTO guy. One of the things you can do with an elastic compute cloud is to create templates for new machines, and let other people run them. So you put these things together, and you get the Tile Drawer.
Tile Drawer is a new thing I've been working on that makes it fast and easy to run an OpenStreetMap tile server on Amazon's infrastructure for ten cents per hour, with just about no configuration at all. When you instantiate the Tile Drawer AMI (ami-e1ea0a88) you provide two bits of information:
- The geographical bounding box of an area you'd like maps for, and
- a Cascadenik stylesheet for how it should look.
Your new instance will boot itself up, and immediately start pulling down OpenStreetMap data to render map tiles with. This is pretty much the whole story.
I have a couple example stylesheets up for your use, and I'm very interested in adding more. I'm excited by the idea of a community-maintained collection of cartographic styles, all of which can be immediately applied to any geographic location covered by OpenStreetMap. I'm also excited by the idea that designers can create and rapidly use new kinds of map renderings - we've been plumbing the depths of customized Mapnik renderings for a few years, and it's time to see it break out into wider use. We're already seeing beautiful new map designs like Craig Mod's Art Space Tokyo book, Wilson Miner's EveryBlock maps, and Matt Jones's Lynchian_Mid Cloudmade style for Dopplr. There should be more.
The availability of the OpenStreetMap data set itself is a whopping great slab of social surplus. What did people do when you still needed to get someone from NavTeq or TeleAtlas on the phone for an indeterminate amount of money when you wanted some map data? I was hearing from new Google friends at the Camp Roberts thing a few weeks back that even they reach for OSM when they need to experiment. It's so simple, the whole thing is available, all the time, with regular updates. I'm hoping to see it continue to gradually replace other source of map data for normal, day-to-day city navigation use.
There are a few things that Tile Drawer does not do yet, because it's new. For example, it does not keep up to date with OSM updates. Since it's so cheap and easy to fire up additional instances, I'm imagining that this need can be addressed for the moment by periodically creating replacement Tile Drawers and killing old ones. It doesn't serve anything other than OpenStreetMap data. It doesn't do WMS. It doesn't render multiple styles at once. None of these things seem important yet, which doesn't mean they won't happen at some point in the future.
But first go check out Tile Drawer.
Aug 23, 2009 4:09am
geological training wheels
David Smith has an excellent post on Dunwich, Suffolk that ties together several historical and paleontological threads connected to the town and the North Sea generally.
Some excerpts of excerpts:
The town was losing ground as early as 1086 when the Domesday Book, a survey of all holdings in England, was published; between 1066 and 1086 more than half of Dunwich's taxable farmland had washed away. Major storms in 1287, 1328, 1347, and 1740 swallowed up more land. By 1844, only 237 people lived in Dunwich.
Also:
The British continental shelf contains one of the most detailed and comprehensive records of the Late Quaternary and Holocene landscapes in Europe. This landscape is unique in that it was extensively populated by humans but was rapidly inundated during the Mesolithic as a consequence of rising sea levels as a result of rapid climate change.
And:
In 10,000 BC, hunter-gatherers were living on the land in the middle of the North Sea. By 6,000 BC, Britain was an island.
This and the Bering land bridge make me think of slow movements that stretch out the bounds of possibility. Imagine living on the North Sea plain as it fills in with water over a period of four thousand years. For a few generations, you can move freely from east to west and back. Soon, rivers and marshes might start to creep in and eventually the two landmasses are separated, but still within a short row of each other.
The psychological space between the two coasts starts small; it's understood that the water boundary between is easily surmountable because it's just the equivalent of a creek or a bay. As the separation grows, the mental model of the growing North Sea continues to flag it as a path rather than a wall, you just have to improve your transportation technology periodically to continue moving back and forth. This is like learning to ride a bike with training wheels: you get used to the idea of being upright while you have a shim in place, then as the shim goes away you learn to remain upright on your own. Keep moving, balance with the handlebars. Skills that appear impossible to learn are acquired through the use of now-gone crutches.
Look at this map that Matthew Hurst posted today:
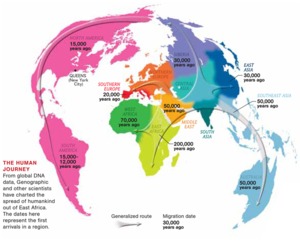
You can see a 50,000 year gap between settlements on either side of the 8 mile wide Strait of Gibraltar. There's no such gap between England and the continent, those places started out settled together, and remained so even after the Holocene split. The now-submerged floor of the North Sea was like a set of prehistoric training wheels, helping to mark the path to Britain as a possibility and encouraging the upkeep of technology to keep it so. The always-divided Strait of Gibraltar did no such thing. Knowing that something is possible makes it seem sane to work to attain it. Believing that something is easy can have the same effect: "I once asked Ivan, 'How is it possible for you to have invented computer graphics, done the first object oriented software system and the first real time constraint solver all by yourself in one year?" And he said "I didn't know it was hard." Moore's law in computer development is like this as well, establishing a base rate of expectation to guide the frantic pace of development for decades afterward.
Anyway.
Aug 22, 2009 7:02pm
walking papers localization
I'm super happy to say that Walking Papers Issue #9 has just been closed, thanks to the invaluable help of Jonas Kreukel and Milo van der Linden, who graciously volunteered to translate the entire site into German and Dutch, respectively. This is my first venture into a completely-localized site, and it's now set up to allow other volunteer translators to offer their own languages. Poland, France, and Italy currently hold the 4th, 5th, and 6th position in the country zeitgeist, any takers?
Aug 17, 2009 4:40pm
pick us for sxsw 2010
It's panel picker season again. Here's us:
Maps, Books, Spimes, Paper: Post-Digital Media Design
The Internet is situated in the real world, and interesting experiences have to blend physical and digital. Mixing new technology - Arduinos, GPS, RFID, QRcodes - and old (web, paper), we present examples of the recently possible future, and the lessons we've learnt. And we'll make something along the way.
- Chris Heathcote (meta loca)
- Aaron Straup Cope (Flickr)
- Michal Migurski (Stamen)
- Ben Terrett/Russell Davies (RIG)
- James Bridle (Bookkake)
Create a SXSW account if you haven't already and give us a thumbs-up. Here's another good one to vote for while you're there: God / Admin Interfaces with Gavin Bell, Matt Biddulph, and Kellan Elliott-McCrea. Now to go look through the remaining 2K+ panel ideas for interesting ones that haven't been specifically brought to my attention by friends...
Aug 10, 2009 5:05am
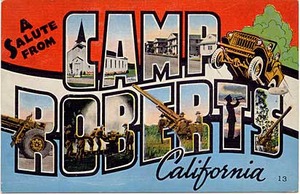
dispatch from camp roberts
Mikel has me beat with a series of four posts about our recent adventure to Camp Roberts near Paso Robles in Central California. Sean's also got a great run-down from Google's perspective.
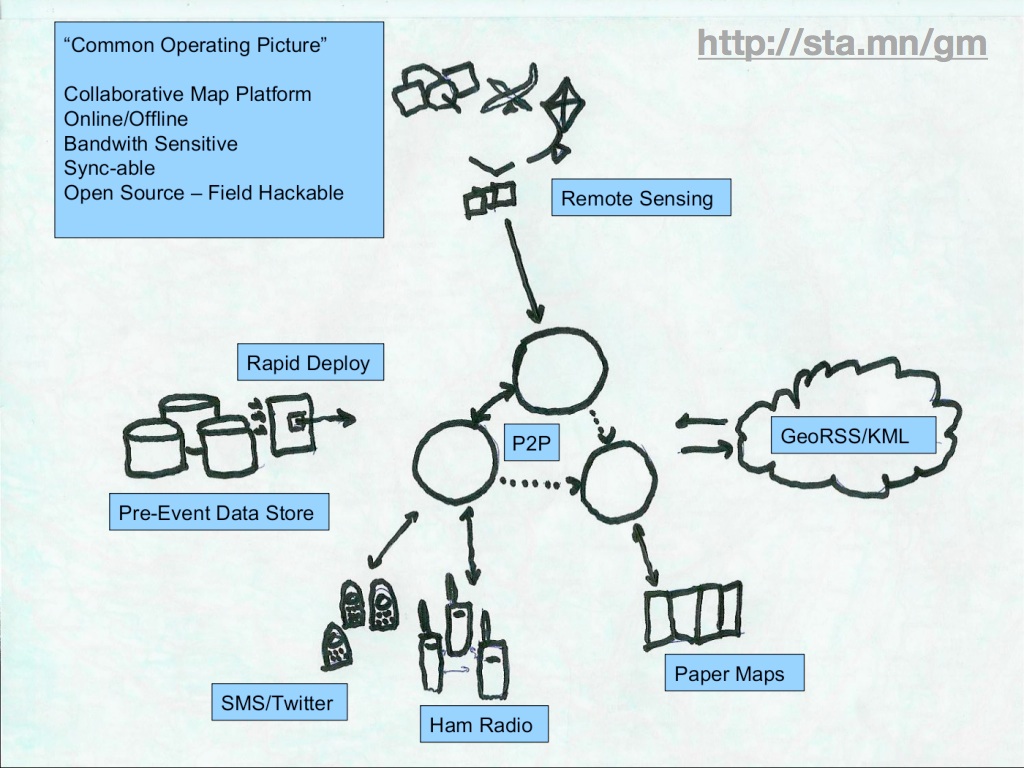
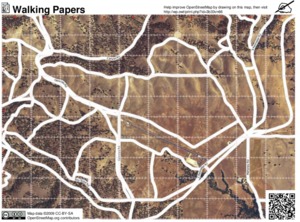
John Crowley of STAR-TIDES (Transportable Infrastructures for Development and Emergency Support) drew on a range of worldwide development talent to participate in a hypothetical Afghanistan disaster scenario, featuring remote location, unpredictable connectivity, limited time, and rapid assembly of geographic data from sources like UAVs and on-the-ground observation. Some of our co-participants included Google with accompanying Fusion Server, InSTEDD and their SMS-based geochat system, DevelopmentSeed's Drupal-based monitoring and coordination software, and my own dog in the fight, Walking Papers. The week served to validate many of the concepts sketched out in Aaron Cope's Papernet, and also helped to make the "paper" arrow in Mikel's own 2007 OSM dream napkin sketch point both ways.

The rough workflow we settled on early in the week had aerial imagery sources at one end and OpenStreetMap at the other. Developer / geographer John Livni adapted Modest Maps ws-compose, an HTTP wrapper for generation of static images from tiled map sources, to use locally-provided inputs, transparent OpenStreetMap overlays, and reference grid lines for easier communication. Interns organized by the Naval Postgraduate School tested interim ideas out in the field.
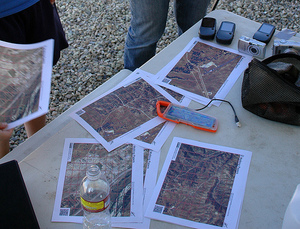
Mikel Maron brought a local installation of the OpenStreetMap server, with which he was able to quickly supply a source and destination for geodata used in the project.
The immediate goal of the project was to provide world-traveler Todd Huffman with a portable Mac Mini installation of Afghan aerial imagery, a modified version of Walking Papers, Sahana, GeoCommons, Geochat, and other just-integrated software for remote experimental use in Nangarhar during the rapidly-approaching 2009 presidential election.
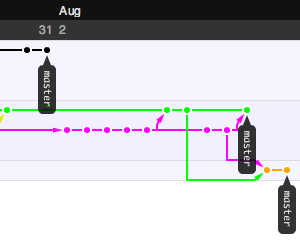
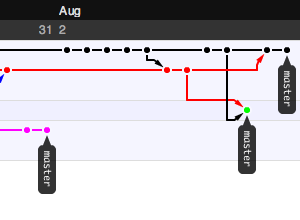
Interestingly, the event setting itself replicated many of the field conditions we might expect in the real world, most importantly a criminally spotty internet connection. This turned into an advantage, partially because we were able to ignore our usual distractions for a period of time, and also because we had made the fortunate choice to use Git earlier. Git was a serious champ here, making it possible to share source code repositories on a local network without losing global context but also without requiring an always-available connection to a central repository. I'm not going to waste too many words on Git advocacy, except to make the point that a good version control system lives and dies by the ecosystem of other tools built around it. I didn't move Stamen over to Subversion until I had seen Trac and all the ways it improved project communication. I also did not consider adopting Git until after I explored Github, the web-based "social coding" site. The killer feature for me was a way to follow others' projects, and graphical network view providing a visual history trail for each repository. Here are some example screen grabs showing views of the Walking Papers "paperwalking" repository from the same point in time, from three forked points of view:

My Git use is still purely experimental, but I'm keeping a close eye on Matt Biddulph's Git links.
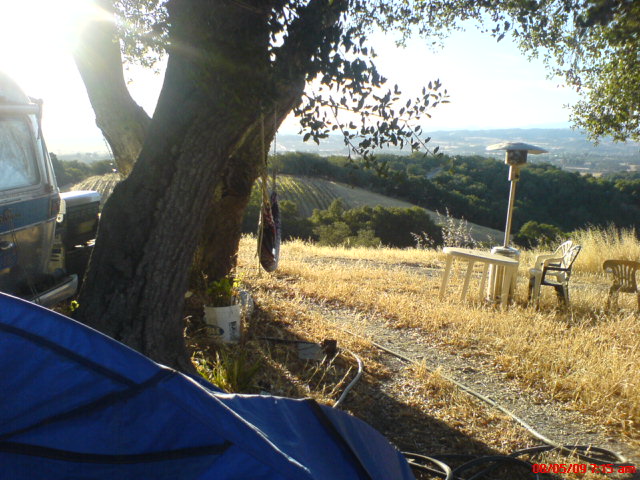
The other half of the week was a lovely camping spot provided by Josh's pal Steve Martell, whose Kaleidos Winery has some of the best rural views and good times I've yet experienced.
It was all a little bit of this...

...and a whole bunch of this.

Jul 31, 2009 11:51pm
published author
My first copy of Beautiful Data arrived in the mail today.
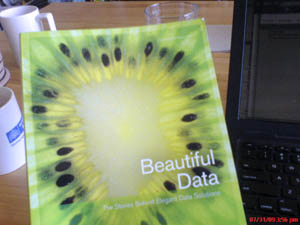
This is the first bound-and-printed book-looking thing I've been a part of, thanks to an invitation from Toby Segaran and Jeff Hammerbacher. I'm in the middle with a chapter on Oakland Crimespotting, straddling the color plates and tucked in amongst such luminaries as Jeff Jonas, Aaron Koblin, Jeff Heer, Nathan Yau, Peter Norvig, and others.
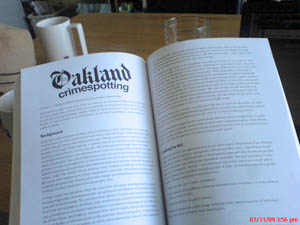
The book available now from O'Reilly and Amazon. Author royalties from the sale of this book are being donated to Creative Commons and the Sunlight Foundation.
Jul 11, 2009 3:37pm
open paper maps
I'm at State Of The Map, the OpenStreetMap conference. I just finished up a talk that's a little about printed maps, and a lot about Walking Papers.
Here are my slides, now back to the conference:

Jul 2, 2009 6:50am
blog all clipped passages: what was the right speed?
These are excerpts from an article sent to me by Sha after I made an offhand comment about projection speeds of old silent films, thinking of this old view of San Francisco in particular.
Normally I blog all dog-eared pages in books that I read, but now I'm a Kindle owner so I have to use the built-in clipping mechanism to get the same page-marking outcome. It's better to read on, but not as good to mark books with. Possibly this is a moot point, because I haven't actually purchased a book for the Kindle yet - most of all I read things from the web, via Instapaper's Kindle feature.
The most interesting new thing I learned from this was the existence of a tug-of-war between cameramen, projectionists, and theatre owners, all of whom had a variety of ideas about what looked good on screen, what constituted a correct speed, and what was economical to show. I recommend you read the whole thing, but here are a few good bits.
One transfer to media with invariate speeds:
We used a variable speed telecine machine called a Polygon. Because they are virtually obsolete, suitable Polygons in Britain exist only at the BBC- which has both 16mm and 35mm models. Fitted with a 28-sided prism- 'The Flying Ashtray'- the Polygon enables you to transfer film to videotape at any speed from 4 fps to 35 fps.
On differences in equipment:
An Edison film of 1900 will generally project satisfactorily at 24 fps. Edison's rival, the American Mutoscope and Biograph Company, used a camera which weighed 1700 lbs. This camera had a motor, and it turned at a speed of 40 fps. ... During the Nickelodeon period, films were projected at whatever speed suited the management. The standard was supposed to be 16 fps.
(Holy shit, what a name: The American Mutoscope and Biograph Company)
On competition between exhibitors and producers:
Projected at the 'correct' speed of 16 fps, a full 1,000 ft. reel of 35mm film would last 16 1/2 minutes. The Essanay Film Company of Chicago tried to beat wily exhibitors by printing the running time of the films on the posters. The exhibitors retaliated by pasting a strip of paper over the line. Some unscrupulous theatre managers could get through a full reel in six minutes! Ten minutes was acknowledged to be 'more usual'. Yet, even today, on standard 24 fps sound projectors, 1,000 feet takes eleven minutes.
On the active role of the projectionist:
A 1915 projectionist's handbook declared- in emphatic capitals- 'THERE IS NO SUCH THING AS A SET CAMERA SPEED!' The correct speed of projection, it added, is the speed at which each individual scene was taken- 'which may- and often does- vary wildly.' And it declared: 'One of the highest functions of projection is to watch the screen and regulate the speed of projection to synchronise with the speed of taking.'
On getting used to a higher speed:
While filming Annapolis in 1928, cameraman Arthur Miller received a wire from the studio to crank at 24 fps. He did so, and everyone complained that the speed slowed everything down too much- it was particularly noticeable in a dress parade scene of midshipmen.
On optimization for higher projection speeds:
Talking about comedies, Walter Kerr writes: 'Silent films chose, by control of the camera and through instructions to projectionists, to move at an unreal, stylised, in effect fantasised rate.' And he quotes as examples the last two silent Chaplins- both films designed to be shown at sound speed, but photographed at silent speed (whatever that was!). 'The least glance at Modern Times reveals instantly that all of Chaplin's work in the film... has been filmed at a rate that puts springs on his heels and makes unleashed jack-knives of his elbows. This is how the films looked when they were projected as their creators intended.'
The last excerpt in particular makes me think of tuning for low-end media, such as mixing Beatles songs with shitty AM radio speakers or testing hip hop through cell phones. Where will your work be encountered, and what will it feel like when seen or heard there?
Jun 29, 2009 5:56am
we are all screen readers now
In 1998, the Web Standards Project (WaSP) opened its doors with the rallying cry "to hell with bad browsers". Their goal was support for W3C web standards with the aim of preventing development costs from skyrocketing as the major browser makers of the time (Netscape and Microsoft) split the public with two diverging products.
One of the core arguments made by standards advocates focused on accessibility requirements, in particular the design of web pages that were available to blind users with screen reader software. Use semantic markup in place of layout tables, single-pixel image shims and GIF text, and what you write will be readable by everyone. I remember making this argument at the web design company I worked out fresh out of college, and it was always a bit of a hard sell even to myself. I didn't quite believe in the legions of blind users out in the world struggling to access my rave flyer portfolio through Jaws, and after a while it all took on a sense of righteousness-for-its-own sake, purity in the face of ugly real-world commercial requirements.

Fast-forward ten years, and I'm now using all those accessibility features on a daily basis. At some point during the dot-com bust it turned out that the written word was the payload, and regular people started using alternative browsing devices to access text from the web. Arguments about device-independent, semantic markup and graceful degradation suddenly have an additional halo of legitimacy because they affect everyone.
I recently bought a Kindle, and I'm again thankful for the past decade's vogue for separation of style and content. I'm pleasantly surprised by the dissolution of technology into behavior, with my "read later" Instapaper bookmarklet that time- and space-shifts all the usual tl;dr's into BART-compatible slugs of pure text on a reflective screen. Meanwhile Arc90 Lab has produced Readability, the browser bookmarklet designed to suss out usable signal from "all the insanity that surrounds the content we're trying to read". All those years of making half-hearted arguments for disabled visitors are paying off in usable content for everyone else. I read more now, and more effectively. Talented web designers are arguing for the abandonment of old technology that shackles content to form.
The web is the best thing that ever happened to reading.
There's one area that's lagging, and it's PDF. I love reading academic papers, but they're generally set in a two column skeuomorph form that's hell on Amazon's PDF-to-Kindle conversion feature. The text comes out interleaved, with a line from the left column followed by a line from the right column, repeat. Amazon does OCR on bitmapped PDF's, but they can't yet figure out this dinosaur format.

I'm looking forward to the day I can bundle everything off to Instapaper and the Kindle for later digestion. I'd love to see this last print-dependent content form liberated from uselessness.
Jun 25, 2009 9:04am
fever again
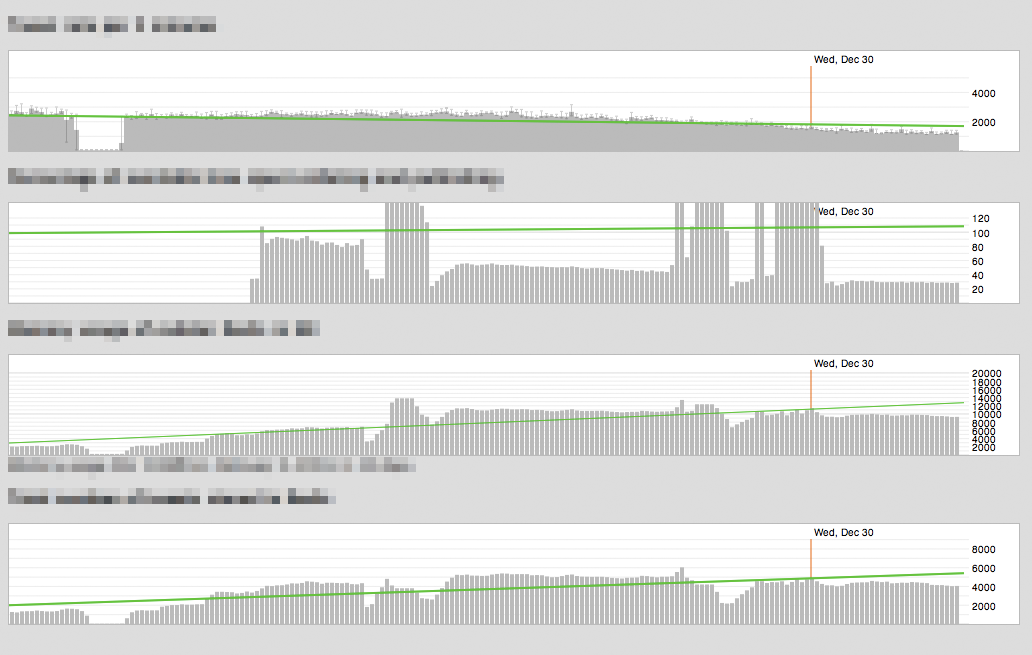
I mentioned a few things last week I thought were interesting about Fever, Shaun Inman's new web-based feed reading tool. Feed readers as a technology have basically remained stationary for a number of years, so I'm excited by the idea that someone is rethinking them in some way. This is a set of hastily-written notes based on my experience with Fever.
I'm a little harsh on the application in places, so it's worth mentioning that I think Shaun Inman has made a beautiful thing, and apart from the gripes listed here, I'd probably recommend Fever to anyone who's looking for a basic feed reader and wants to avoid being tethered to a single desktop or remote service provider.
First, my bias: four years ago, Mike Frumin, Boris Anthony and I were working hard on Reblog, the Eyebeam-supported tool for reading and republishing RSS feeds. Eyebeam used it to curate feeds about art and technology, with weekly stints by guest Rebloggers using software initially created by Frumin. I'm told that Tumblr's Reblog feature was explicitly influenced by our Reblog. Even though ours is for all intents and purposes a dead project, I continue to use it every day as my primary reading and republishing mechanism.
I'm interested in Fever because I'd be happy to move away from Reblog if the right tool came along, and the core promise of Fever, to show you what's most highly attended-to in your collection of feeds, is a pretty exciting one, like a personal Memeorandum or Digg.
I went ahead and bought a copy of Fever to give it a test run. It's server side software, and there doesn't seem to be anything like a demo mode. You need to cough up $30 to see what it's like. Now that I've tried it out, I have some additional things to say about this software in particular and web interaction patterns in general.
Install
The installation process is a breeze, and extremely innovative to boot. There are three steps: you start with a small seed application on your own server, you make it world-writeable so that it can modify itself, and then you link it to a paid account on the Fever website. The complete application is pushed to your server without your intervention, and you're off to the races. I'm fairly certain I've never seen anything quite like this before: usually PHP/MySQL software is more like Reblog or Wordpress, where you unpack the thing as a complete unit, install the database and so on yourself, and do your own configuration. Fever seems to have some basic protections in-place to prevent malicious outsiders from scrambling your installation, but there's a completely fascinating power inversion at play. Where the entertainment and software industries have spent millions or more trying to develop bulletproof phone-home mechanisms to ensure that your local copies of their media refuse to play without remote authorization, Fever takes advantage of its naturally web-facing nature to establish a link back to its home base. Because Fever doesn't ask you to change the folder permissions back from world-writeable, I was curious whether Inman would use this as a vector for remote software upgrades.
I saw this just the other day:
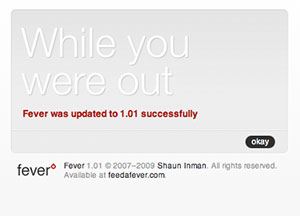
Just now I saw a second one, for version 1.02. The messaging here is astonishing: while you were out, something you own transformed itself into something new.
Overall though, installation was a breeze: it took a few minutes (including some wrangling with the always-execrable PayPal) to get set up.
There are two aspects of Fever's design that I'm not altogether happy with.
Hover
The first is hover controls, described by Smashing Magazine:
When a user interface has many elements in which the user can perform actions, the page can become cluttered and hard to scan. This is especially common in the administration section of Web applications, where users can change table data. A good way to handle this is to hide each element and reveal it when the user hovers over that area.
Fever uses this technique to a frustrating degree, shown in this animation of me moving the mouse from the left side of the browser to the right:

Whole swaths of functionality hide and show themselves, including various management controls, an iPhone-style alphabetical navigation column, and highlighting of feed items on the right hand side. Personally, I think this is a particularly terrible form of mystery meat navigation. It's difficult to discover what actions are available to you in an application if you need to fly around the screen with your mouse to look for controls, and the particular design of Fever doesn't let the hover controls save any particular space or clutter. Commenter James Schend on the article linked above describes a second way in which this pattern is harmful: Beware, hover controls only work on devices that have a mouse. They're useless on iPhones. (And tablet PCs, and touchscreen kiosks, etc, etc.)
Overall, the high amount of mouse-reactive interface mutability in Fever makes it feel shaky, jittery and tentative. There are places where it doesn't even help, e.g. what the fuck is this?
This idea of subjective perception of physical stability in interactive software is something I think is particularly hard to get right, but enormously important - Apple's work in particular seems to absolutely nail this every time, through the acceleration models in their basic widgetry, particularly on the iPhone and trackpad.
My recommendation here would be to simply turn all this stuff off, and leave all the UI elements on-screen and unresponsive to simple mouse movements. 99% of desktop UI conventions simply don't make sense on the web (I'm looking at you, drag and drop).
Distance
The second aspect of Fever's design that I'm not altogether happy with is spooky action at a distance. By this I mean pieces of the page that influence other pieces of the page without apparent reason.
Fever uses the now-common AJAX technique to perform updates, allowing users to delete articles and modify feed subscriptions within list views. The frustrating thing about Fever's implementation of this technique is that it visually centralizes the wait indicator: you perform an action such as deleting an article on the right-hand side of the browser window, a wait spinner appears on the left-hand side of the window, time passes, and finally the visual result of your action modifies the appearance of the page. Your single action has effects in two places and two times, and your attention is split.
To be fair, Fever is not the only offender here. For a long time, Twitter used this same pattern when posting updates from inside the web interface, with a tiny spinner tucked up and away in the corner of the screen, far away from the text and button form elements you used to make your update. They've since mended this particular problem (while simultaneously introducing some really ill-advised link-breaking AJAX-based page replacement navigation).
When you perform "bigger" actions, Fever uses a modal dialog box to ask for confirmation, something I've always called The Ghetto Shield because it's so lame. Here's me trying to add an item to a blacklist:
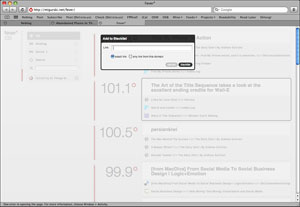
This is another desktop UI convention that has no place on the web. Even Apple left this in the dustbin of history when it replaced system-blocking dialogs with per-window sheets with the introduction of OSX.
My recommendation here would be to take advantage of AJAX and HTML's ability to localize action and reaction: changes should take place where and when you made them, even if their confirmation takes time. This is something that I continue to believe we got absolutely right with Reblog back in 2005. As an example, here's the bit of interface Reblog provides for adding tags or comments to an article prior to republishing it:
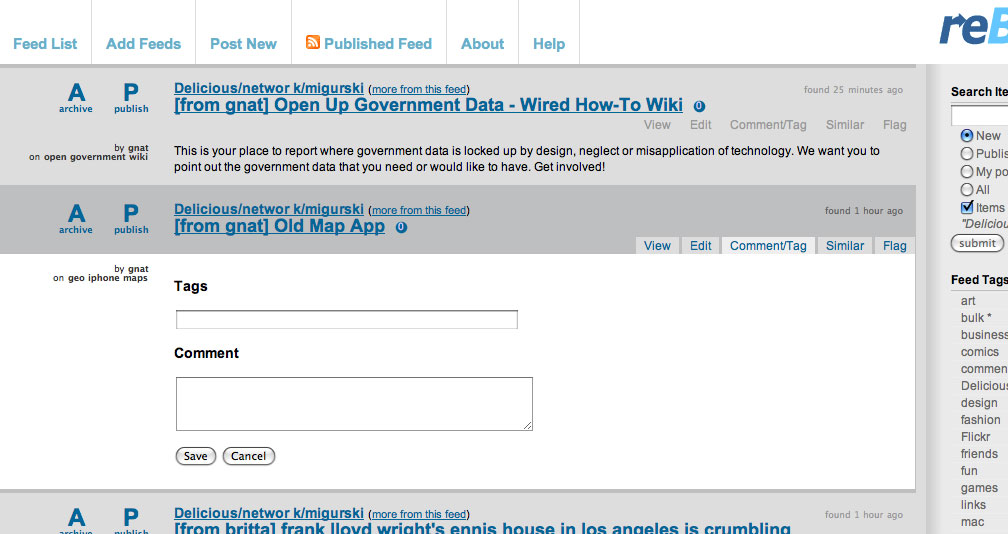
The form replaces the content of the item (it's invoked by the small tabs to the right), so that you can have as many forms as you have items. No modal dialog, just an asynchronous modification in place. We also handle the split attention issue here by placing loading spinners near their associated actions. In this example, you'd publish the article by clicking the big letter "P" next to its title, which would be replaced by a spinner for a second or two until the action returns successfully. If you were to archive the article (mark it as read), the content immediately disappears leaving just a collapsed title bar area to indicate that you want it gone, the "A" is replaced by a spinner, and soon it's visually labeled "archived". Crucially, this allows you to immediately shift your attention to the next article in the list, knowing that there will be no further motion of on-screen elements to further distract you. Fever by contrast doesn't remove the article from the screen until after the server has confirmed that it's gone, making it necessary to hang around waiting for your action to have an effect before you can safely move to the next article.
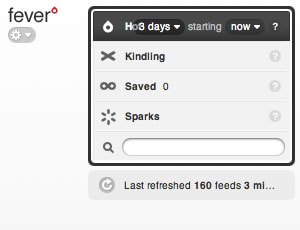
Temperature
I've not said much about the core feature of Fever, its ability to dig through your articles and "take the temperature of your slice of the web and shows you what's hot".
What Fever gets right is that that it looks at all the links in each article, not just the primary linked article. This means that if a lot of authors of various blogs are all pointing to the same story, it will have a higher-than-normal temperature and will bubble to the top of the Hot view.
It turns out that even in the nearly-200 feeds I'm subscribed to, the link overlap between feeds seems to congregate around some pretty mundane shit. Steve Jobs's liver transplant, that guy who got his iPhone back, etc. I'm interested in this stuff exactly once, then I would like to mark it read. Fever offers a "blacklist" feature in this view, but that's not quite what I want: it's not spam, it's just something I've read and am finished with.
I'm not sure what my recommendation here would be. This is the difficult part. Recommendation engines are hard, and the task of building one that operates just on your personal stuff with minimal input is even harder. I hope that this is an aspect of Fever that Shaun puts additional future effort into, because it shows the most promise of any part of this interesting application. If he manages to really nail this down, I will changes RSS readers and even do the plug-in plumbing work to drag my republishing activities over. Happily, Fever will continue to update itself with fresh version while I'm out.
Jun 22, 2009 6:00am
walking papers: end of week two
Right, so two weeks ago I pushed Walking Papers out of the nest, and it seems to have avoided the ground so far. This is a progress report.
The reason I chose June 4th to make it live was the OpenStreetMap mapping party on June 6th, up in the Presidio Sports Basement store "big room". The event was the first public use of Walking Papers, and we presented it as a basic alternative to the usual GPS method of collecting map data. Several attendees jumped in, and we got a few excellent submissions including a survey of the marshy land east of Crissy Field and absurdly high detail of businesses along Chestnut St. These two scans were such a thrill: the technology worked and we got legitimately street-level data from enthusiastic participants!
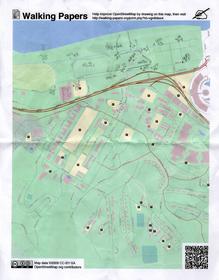
The most common piece of feedback I saw from users was to allow for landscape orientation in scans, so I added that feature this weekend. It's now possible to print maps in either landscape or portrait orientation, and the image recognition code distinguishes between the two based on aspect ratio. Users immediately started using the new orientation, including one German collecting house numbers:

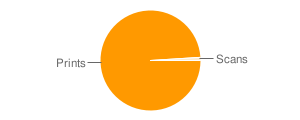
Generally speaking, we are seeing loads of prints and not very many scans. It's incredibly easy to hit the "make" button on the front page, less so to actually collect some useful information, so I'm not surprised by the disparity. I am looking forward to seeing more activity though, starting with a scheduled mapping party on June 27th and 28th at RPS.
We've seen some very welcome feedback as well.
Austria's ORF Futurezone published an article devoted solely to Walking Papers on the 10th, which explains the disproportionate presence of many Austrian prints and resulted in a huge traffic bump.
Stefan Knecht of Germany's United Maps said the project was "just lovely", which was very nice to hear from someone whose work is so vital and excellent for online mapping:
Despite or even because of this "post-digital, medieval technology"- it's simply lovely. The reduce-to-the-max, crispy clear website is why I deeply adore Stamen for.
OpenStreetMap superhero Andy Allan pointed out that "even if you don't want to scan back in, it's actually a good interface for just printing maps for annotation."
Jason Kottke also sent some link love our way, in a post also highlighting The Incidental, the post-digital newspaper project Schulze and Webb (and Jones and Davies) at Milan's Salone di Mobile.
So that, in a nutshell, is what is happening with the project. It's nicely steaming along with regular prints, we're starting to see scans from users, we're playing with some ideas on how to more effectively foreground the idea of annotations and scanning on the site, the code continues to be freely available on Github, and I'm actively trying to boost real on-the-ground use of the system for actual mapping.
Jun 18, 2009 6:55am
fever
Shaun Inman just launched Fever, a web-based feed reading tool that you buy and install on your own server.
A few interesting things:
- Fever implements SnarkMarket's "compress into diamonds" idea: When I click that button, spin your little algorithmic wheels and turn my reader into a personalized Memeorandum. Show me the most linked-to items in the bunch, and show me which of my feeds are linking to them.
- I always wanted to turn Reblog into something like Fever, but never did.
- It's written in PHP, which makes me happy. All this blibber-blabber about web-based MVC development frameworks, and PHP is still the works-everywhere-including-shared-hosting common denominator. It's truly the Bourne shell of the internet.
- The installation procedure, esp. the way it ties in with the main Fever website, seems to be a way for Shaun to watch his user base, verify that installations are paid-for, and smooth the process all in one shot. Is it also a way to push updates, and is the chmod -r a+rwX step a possible point of exploitation? Too early to tell. Watch the video on the site, the installation bit is at the end.
- It's being marketed and sold like shrinkwrap software but you need an account on the website to install and license it.
- The division of feeds into must-read and might-read is pretty reflective of how most people think about their feeds in my experience.
- Drag-and-drop on the web is stupid.
- The grouping of entries based on linking is, to me, more of a way to mass-delete things that everyone's gabbing about rather than a pointer to what's actually interesting. When I imagined doing this kind of cross-item-similarity for Reblog, I imagined it as a way to quickly identify pockets of groupthink or P.R. clusters and rapidly/easily eliminate them. Just think, I could have handily avoided last week's internet-wide Google Wave boner!
- I'd totally install and use Fever if I didn't use Reblog for publishing as well as consuming - all of my snippets and most of my Delicious links are tagged and published directly from my feed reader. It'd be cool if Fever could do this, maybe as a plug-in.
Jun 18, 2009 4:54am
people clouds
Delicious has a related-tags feature that I've been greatly enjoying since Rabble told me I should probably tag my links. Normally, the list of related tags is designed to suss out content, but I've been using people-tags in addition to topic tags. If I get a link from someone, I tag it with via:username. If I post a link about someone I know, I tag it with re:username. Related tags gives an interesting view on some of the folks I follow most closely.
I've only been conscientiously tagging my links for a few months, but already I'm starting to get a clear picture of the kinds of material I get from my friends. I love the idea that a nice stick-and-rock diagram can be made to sum up the specific expertise of people I know, and the topics I look for from each of them.
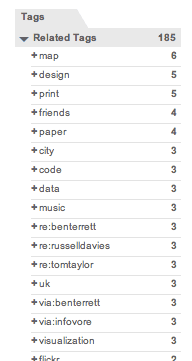
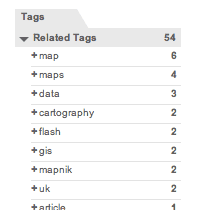
First though, I want to talk about how everyone I know is doing awesome shit. A quick look at related tags for this one shows who they are and what they're doing: maps, design, code, stuff about cities and paper, and a little cluster of Brits near the top. That group of three re:'s happens to be the Really Interesting Group:
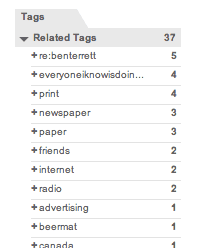
Looking just at links about Russell, you can see his co-conspirator Ben right at the top, a long with a short list of what they're thinking about: printing and newspapers and things that friends do on the internet:
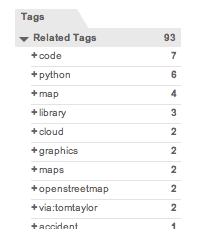
Aaron is all about the papernet in real life, but the things I really follow from his postings are the Python code libraries for doing cloudy stuff with maps:
Zachary Johnson, whom I've never met, is all about maps and cartography:
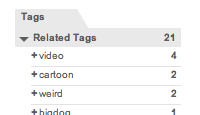
My brother Zak, on the other hand, is a primary source of weird animated video:
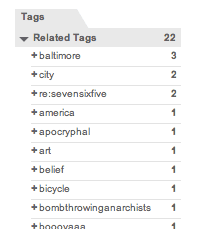
Fred meanwhile is Mr. Baltimore architect, and as often as not I repost things he writes himself:
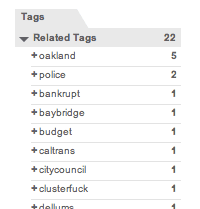
Finally, top Oakland blogger V Smoothe is all about local Oakland business:
Do you tag your links like this? Does it help you develop a sense for those in your circle who are go-to people for certain topics? Does it help you get through your daily reading to know what certain people are best at? Don't you wish that Delicious would let you check your own name for the hive-mind consensus about what you're good for?
Jun 4, 2009 7:20pm
walking papers lives
OpenStreetMap, the wiki-style map of the world that anyone can edit, is in need of a new way to add content. I've been working on a way to "round trip" map data through paper, to make it easier to perform the kinds of eyes-on-the-street edits that OSM needs now the most, as well as distributing the load by making it possible for legible, easy notes to be shared and turned into real geographical data.
Walking Papers is a working service that implements this paper idea, based on initial technical experimentation from back in February.
Three Kinds Of Mapping
A rough road network of the United States has been basically complete in OSM for some time now, since the bulk import of the US Census TIGER/Line data set. This means that U.S. mapping parties can be slightly counterproductive: the party format was designed for places where raw GPS traces are needed most of all, and participants frequently create fresh data for a given location for the very first time. You show up, are given a handheld GPS device, quickly schooled in its use, and sent out on foot or bicycle or car to collect traces of nearby roads and pathways.
Because we taxpayers have funded the creation of free, public data for every road in the U.S., raw roads generally already exist in the database. TIGER data can be inaccurate, but with the gracious licensing of Yahoo aerial tile imagery, it's possible to correct misplaced roads without actually leaving your desk - simply use OSM's built-in editor to move streets around until they match those seen on the underlying satellite imagery. This kind of gardening or tending activity can be great fun in an OCD sort of way, and I've personally killed many hours moving nodes here and there to improve the accuracy of street grids.
There's a third form of map editing that I think is best addressed by paper, and that is the annotation of local, eye-level features that would be invisible on an aerial image, meaningless in the absence of base road data, and impossible to collect without a site visit: street lights, bike shops, restrooms, cash machines, stairs, cafes, pubs, addresses, and other bits of geographic context that make OpenStreetMap such a strong contender with the larger, commercial services at a human scale.
Fixing #3
Currently, there aren't any methods in place specifically designed to address this third kind of casual local mapping.
Walking Papers is a website and a service designed to close this final loop by providing OpenStreetMap print maps that can be marked up with a pen, scanned back into the computer, and traced using OSM's regular web-based editor, Potlatch. It's designed for the casual mapper who doesn't want to fill their pockets with gadgets to record what's around them, the social mapper who might be out and about taking notes and comparing them with friends, and the opportunistic mapper who might make notes during a commute or a walk if they had a notebook-sized slip of paper to write on. Finally, it's designed for the luddite mapper who would like to help the OpenStreetMap project but needs help from a distributed community to convert their handwritten annotations into OpenStreetMap's tagged data and local conventions.
I'm trying to bridge some of these uses with web service opportunism and old-fashioned undigital fulfillment. Each scanned map is reverse-geocoded using Flickr's flickr.places.findByLatLon API feature, which coughs up a meaningful local name for a given geographical area so you can look at a collection of everyone's scans and perhaps recognize a place you know and might help trace. Each print and scan action is also backed by a (possibly optimistic) promise to snail-mail printed maps to users, and to accept snail-mailed annotated maps in return. If you want to play neogeography pen-pal or simply don't have a scanner at your disposal, Walking Papers can help.
Context
The project is most particularly inspired by Aaron Cope of Flickr and Ben / Russell / Tom at Really Interesting Group, whose Papercamp / Papernet and Things Our Friends Have Written On The Internet 2008 help all this post-digital, medieval technology make sense.
I've also posted before about the underlying technology that makes this work, but I'll recap by saying that it's all off-the-shelf stuff built to run on crappy hosting. More information can be found at Github, where all the source code for this project lives.
Jun 2, 2009 11:17pm
oakland crime maps XII: the pie of time
We just made a substantial change to Oakland Crimespotting that addresses two big ideas: Big Time and Little Time.
Big Time is about history and trends, and you can see it in the newly-opened archives that offer links deep into the past of our crime database, from our first launch of the site in 2007, such as the assassination of Chauncey Bailey that first spurred us to release the project after I'd been personally collecting data for most of Spring and Summer 2007.
Little time is about the hours of the day, and the possibility of seeing neighborhood crime activity on a micro scale: your commute, your evening stroll with the dog, your morning run. The navigation concept we developed to support this is something we've been jokingly calling the "time pie", and it looks like this:
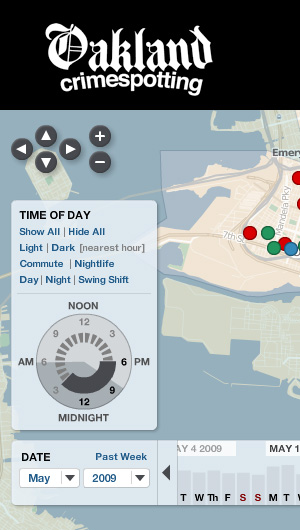
There's more about this on the Crimespotting blog, I encourage you to check it out.
May 21, 2009 9:02pm
flea market mapping
The Where 2.0 conference is just wrapping up, and I was lucky enough to be involved in two sessions.
On Tuesday, Shawn and I hosted a workshop followup to our Maps From Scratch tutorial first performed/taught/endured/magicked at Etech conference back in March. You can read more about the tutorial and check out our public Amazon Machine Image at mapsfromscratch.com.
Earlier today, I got to talk about my love of old-timery map georectification, and these are my slides:
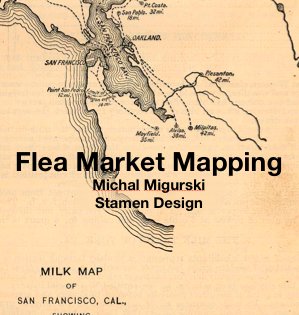
Now I'm listening to Aaron Cope talk about donuts and shapefiles.
May 12, 2009 1:03am
everybody online and looking good
...let's see what we can see.
Stanford's GIS special interest group invited me down to the campus for a guest lecture and a bit of q-and-a, which was great (thanks Nicole). Here are my talk notes in a big PDF like last time; I cover two complementary movements in online mapping: delivery standardizing, cartography diversifying.
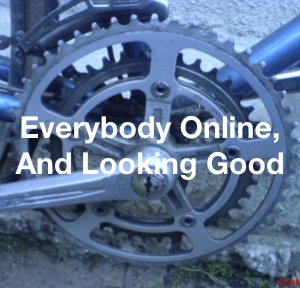
May 8, 2009 4:56pm
anonymous hugging wall
Andy just pointed out the Anonymous Hugging Wall:
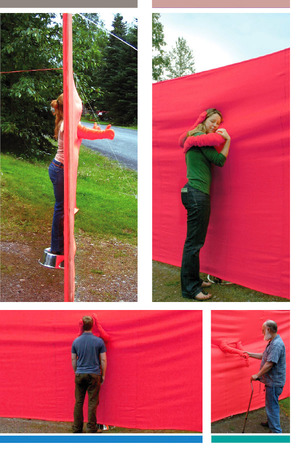
There should have been one of these at every east/west bording crossing during the cold war, on the north/south DMZ in Korea, and each Israeli/Palestine checkpoint. It's silly and creepy and amazing.
Apr 15, 2009 4:34am
thirteen opens
Christian is at BayCHI, and I am not. "When you hear the word open they may be thnking about any one of these 13 things while you're talking about 1 or more of them..." @mlaaker:
-
(1) open source - free to use, community contributions, decentralized, high reliability (the following all @mlaaker) #bayCHI
about 1 hour ago from TweetDeck -
(2) open infrastructure - pay as you go (amazon....)
about 1 hour ago from TweetDeck -
(3) open architecture, anyone can mod your product... on your product, plug 'n' play (mozilla)
about 1 hour ago from TweetDeck -
(4) open standards - community driven, consensus, goal is interperability
about 1 hour ago from TweetDeck -
(5) open ontology ("this is one i just made up") - describe what can not be seen, future proof your data (microformats, rdfa)
about 1 hour ago from TweetDeck -
(6) open access - APIs, mult-channel, third-party developers, partners can build on your platform (twitter, flickr, google maps)
about 1 hour ago from TweetDeck -
(7) open canvas ("drifting to the user-facing side") - product becomes vehicle for 3rd-party content, your content to go (facebook et al.)
about 1 hour ago from TweetDeck -
8) open content - user is the edtor, programming self-relevant content, content comes to you when , content starts hunting you down (rss)
about 1 hour ago from TweetDeck -
(9) open mic - product is populated entirely by users, users own their own content, products support making/discover of content (wordpress).
about 1 hour ago from TweetDeck -
(10) open forum - users contribute ancillary data, ratings, reviews, ranking, link submissions, heavy social interaction (digg, amazon)
about 1 hour ago from TweetDeck -
(11) open door (policy) - users engaged in product, organizational decisions, reveal operaton detail, open communication (getsatisfaction)
about 1 hour ago from TweetDeck -
(12) open borders - users own their own content, data portability, users can vote with their feet, avoid lock-in antipattern (opml)
about 1 hour ago from TweetDeck -
(13) open identity - user as owner of identity, metes it out to sites on their own terms, 1 ID for many sites, power to the people #bayCHI
about 1 hour ago from TweetDeck
Apr 14, 2009 5:34am
the shortest thing that could possibly work
I've been watching the brewing energy around Kellan's rev=canonical mind-bomb from just last week. Les Orchard has this to say:
You guys are moving on this stuff too fast! Welcome to 2002, when lots of us had more spare time than employment and we deployed new crap like this on our blogs and sites daily.
I'm convinced.
One of the small tools that I think would make rev=canonical even more useful is a rapid, brainless way to create short URLs for any domain. It's possible, in a brief PHP script that only knows how to speak HTTP, to:
- Redirect from short URLs to long URLs
- Respond with a short URL for a given long URL
- Add a new short URL for a given long URL
"teczno.com" is already a pretty minimal domain name, so I've gone and made a shortening service at "/s" that does all of the above for every page on this blog automatically, e.g. http://teczno.com/s/x for http://mike.teczno.com/notes/, http://teczno.com/s/47 for this post, and so on. Each time a page here is accessed, it calls home for a short URL and makes a new one if necessary, backed by a tiny, three-column MySQL database. The short URLs get longer as the database fills up.
I've put the whole thing on github, in the hopes that new clients in other languages might be written.
It's called "shlong". =)
Apr 5, 2009 5:33pm
re: diverselessness
Noah Brier noticed a piece of research I linked the other day, on the end of online monoculture. Money quote:
While each customer on average experiences more unique products in Internet World, the recommender system generates a correlation among the customers. To use a geographical analogy, in Internet World the customers see further, but they are all looking out from the same tall hilltop. In Offline World individual customers are standing on different, lower, hilltops. They may not see as far individually, but more of the ground is visible to someone. In Internet World, a lot of the ground cannot be seen by anyone because they are all standing on the same big hilltop.
It's worded as a sharp critique of recommender systems, like the "people who bought" feature on Amazon that's everyone's example #1 of this stuff. I have something of a personal history here, having done some super-early, super-basic research on Digg's recommendation engine before Anton Kast arrived to make it real. One of the challenges that Anton observed is that recommenders can often drop you into a rut, and you have to add a lot of extra logic to work against your own algorithm. In Digg's case, they don't want your recommendations to include too many stories from a single person or small group of people, to maintain a degree of input diversity. I'm an avid user of Fffffound!, and they have a terrible recommendation engine - it routinely pulls you off into the weeds and thickets of a single prolific ffffinder's stream, and woe to you if that person who has great taste in architectural renderings also has a thing for soft porn.
Noah suggests that large-scale movements of this sort aren't well-suited for the web's focusing powers:
...everyone always uses the same few examples for every question about successful internet companies (Facebook, Twitter, Amazon, Netflix at the moment). This happens in every industry, actually, just ask someone to name the best brands and I'll give you $1 if Nike and Apple aren't on the list. But let's put brands aside for a second and focus on the web. The number of successful large scale communities out there is quite small. Now there's nothing wrong with that, but it's the reality of the situation. So maybe, just maybe, that's not what the web is built for. Maybe it's built for small scale communities. Maybe we need to reframe the way we think about this stuff and worry less about "scalability."
I'm not sure it's possible to even encourage smallness; people flock to a good thing and communities grow. Good communities have processes in place for handling change over time, clarify their terms and maintain order organically. I'm thinking in particular about Flickr's community manager, Heather Champ, and the specific guidelines she managed to get approved by legal:
Don't be creepy. You know the guy. Don't be that guy.
I think issues of power and governance are going to swiftly rise in importance on internet communities, as they expand to include more different kinds of people. It's interesting that some of the best, most resonant ideas on these topics that I've encountered over the years has come from political writers and may have been produced even before the internet.
Jo Freeman wrote in 1970 on the tyranny of a structureless group:
Elites are nothing more, and nothing less, than groups of friends who also happen to participate in the same political activities. They would probably maintain their friendship whether or not they were involved in political activities; they would probably be involved in political activities whether or not they maintained their friendships. It is the coincidence of these two phenomena which creates elites in any group and makes them so difficult to break.
There's a hint of the same-hilltop issue here: groups of people watch each other, learn from each other, and sometimes making a really, really tall hilltop for other people can be quite an advance. I'm thinking about the Invisible College or Simon Reynolds's hardcore continuum, where interesting and interested people self-organize into groups, communication costs drop through the floor, and a sudden massive spike in creative output is generated to some end. The Manhattan Project is another good example, just so it's clear that the end isn't always strictly peaceful.
Who decides where the hill goes? A recent conversation between Jay Rosen & Glenn Greenwald about Jim Webb talks about the nature of leadership like this:
...leaders, by talking about things, make them legitimate. Parties, by pushing for things, make them part of the sphere of debate. ... if the conversation of democracy is alive and if you make your leaders talk about things, it becomes valid to talk about them.
Leadership is the ability to direct or coalesce attention, to identify Schelling points. Leadership is a form of power, and there are two critical writings on the nature of group power that I think speak to this idea of hilltop choice. A recent Hoover Institute piece by Liam Julian explores the moral beliefs of philosopher Reinhold Niebuhr, who asserted that only the coalescing and wielding of group power could make change in the world: "They do not recognise that when collective power, whether in the form of imperialism or class domination, exploits weakness, it can never be dislodged unless power is raised against it." There are some excellent connections to Obama in that article, the way his organizational experience is based on recognition and routing of power:
As Obama told Lizza, "The key to creating successful organizations was making sure people's self-interest was met and not basing it on pie-in-the-sky idealism. So there were some basic principles that remained powerful then, and in fact I still believe in."
One of the things that really gets under my fingernails about Facebook is the way that the system seems designed to limit the potential for collective action among its participants: effective limits on the right to assemble and communicate mean that there's a sharp power imbalance in the system, which sounds like small potatoes until you remember that quite literally, everyone and their mother is on Facebook, uses the system to mediate their social interactions, and seems generally uninterested in the enclosing Panopticon. It's reassuring that changes to Facebook's terms of service provoke bursts of outrage that force the company to backtrack, but it would be a lot more reassuring if these changes were made in a public, cooperative fashion. Too much more of this and we'll see a real, online storming of the Bastille.
Another, earlier political philosopher relevant here is Arthur F. Bentley, whose 1906 book The Process of Government carefully lays out the dynamics of group interests, in his opinion the only kinds of interest relevant to the study of governance:
We shall find as we go on that even in the most deliberative acts of heads of governments, what is done can be fully stated in terms of the social activity that passes through, or is reflected, or represented, or mediated in those high officials, much more fully than by their alleged mental states as such. Mark Twain tells of a question he put to General Grant: "With whom originated the idea of the march to the sea? Was it Grant's or was it Sherman's idea?" and of Grant's reply: "Neither of us originated the idea of Sherman's march to the sea. The enemy did it;" an answer which points solidly to the social context, always in individuals, but never to be stated adequately in terms of individuals.
It's significant, to me, that President Obama cut his teeth as a community organizer. Partially I think it means that we're on the cusp of a new self-recognition of group power, because we have a laboratory in which to test it. Where previously we might have been exposed just a few forms of government (federal, state, city), now we are daily and simultaneously subjected to literally dozens: Facebook, Metafilter, Flickr, Delicious, Digg, Slashdot, Twitter, Google, etc. Each of these is in something of a formative, benevolent dictator stage, but the more mature ones have developed infrastructure for self-analysis. Metafilter has the gray and a small team of known admins, Flickr has Heather Champ, Slashdot has a reputation-based moderation and meta-moderation system.
Getting back to the recommendation engine business, I think we're going to see two things happen in the not-so-distant future. One, community participants will have a much clearer understanding of the particular hilltop they're standing on, because the language of recommendation and similarity will enter the mainstream discussion. Two, recommendation engines will mature to the point that their features and techniques will be understood and debated by non-technical (though educated) subjects, much as participatory government is today.
Apr 3, 2009 9:15pm
visualizing a web of data
I spoke at Web 2.0 Expo yesterday. Slideshare is being a complete bitch, so here are my slides in PDF form - enjoy!

Mar 30, 2009 7:26pm
twitter seismograph
There was an earthquake here, about an hour ago. Here is the USGS report map:
(magnitude 4.3, 11 miles out of Morgan Hill)
Here's my homegrown seismometer, a record of Twitter frequency mentioning Oakland:
Most of those messages are twitter people saying things along the lines of "felt it in Oakland!".
I've been recording tweets with the thought that they'd be useful for Crimespotting, experimenting with a bit of RRDtool for tracking time-series data, and playing with Mike Bostock's excellent new Protovis tool for client-side graph rendering in Javascript.
Mar 27, 2009 2:22am
stamen maps cloudmade
Did I mention that we worked with with CloudMade last month, producing three new visual styles for their OSM-derived world maps?
Geraldine did, and CloudMade just announced that our work has been folded into the Style Editor, where you can start with the basics and modify colors to suit your desires.
We used Cascadenik to rapidly generate three new looks that we think are pretty spiff: Pale Dawn, Midnight Commander, and Fresh. Here are some ludicrously large renderings of two of them.
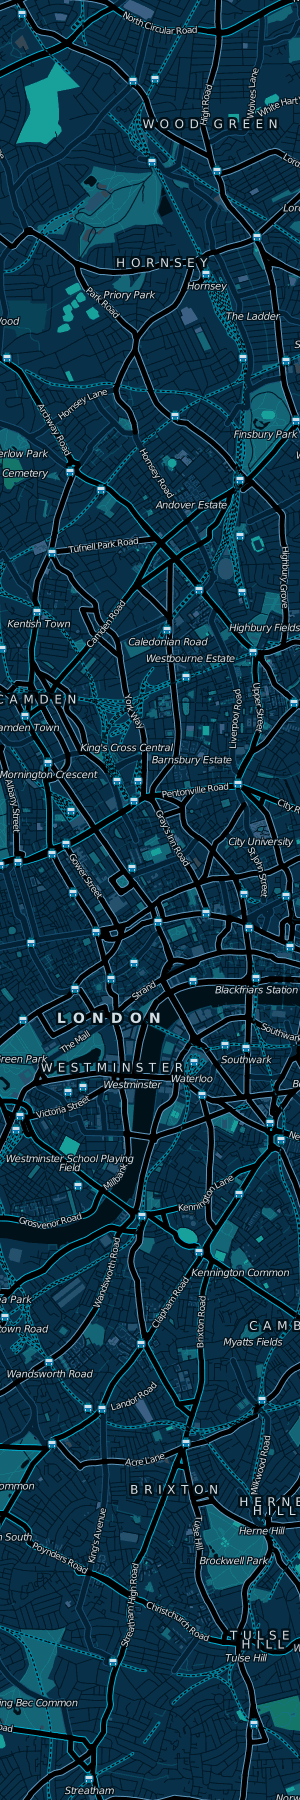
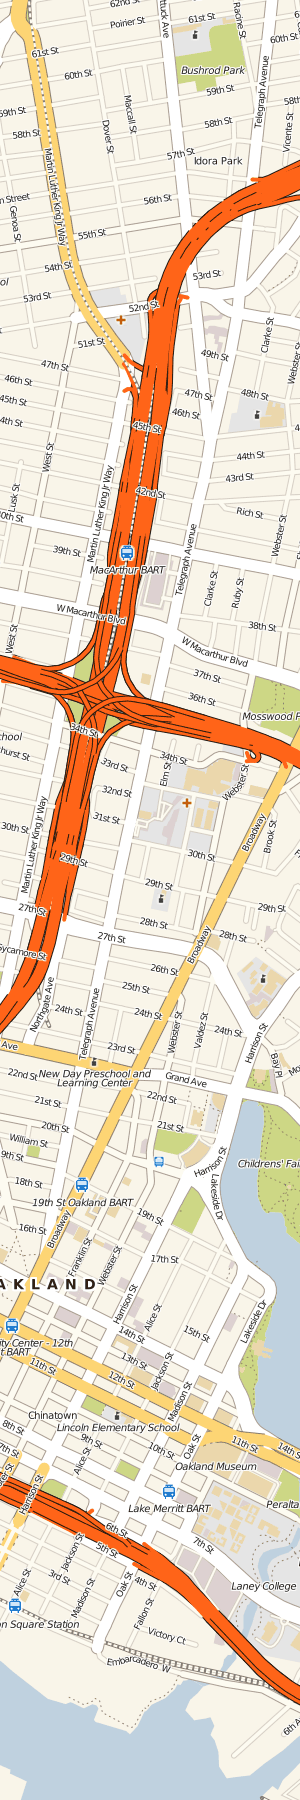
Mar 20, 2009 8:36am
here comes cyberwar!
I have a greenfieldian weakness for papers like Cyberwar Is Coming, published by the RAND Corporation in 1997. They're like GI Joe for grownups, and this one in particular resonated with parallel writings on the impending total dominance of the internet for basic communication.
The authors, John Arquilla and David Ronfeldt, have great admiration for the Mongol Hordes:
...our vision is inspired more by the example of the Mongols of the 13th Century. Their "hordes" were almost always outnumbered by their opponents. Yet they conquered, and held for over a century, the largest continental empire ever seen. The key to Mongol success was their absolute dominance of battlefield information. They struck when and where they deemed appropriate; and their "Arrow Riders" kept field commanders, often separated by hundreds of miles, in daily communication.
It's about information and lines of communication: "the Mongol way of warfare ... may be the closest that anyone has come to waging pure cyberwar.... Use of this example also reinforces the point that cyberwar does not depend on high technology, but rather on how one thinks about conflict and strategic interaction." Arquilla and Ronfeldt show how the Mongols ignored their enemies' conquer-and-hold techniques in favor of a kind of melting through enemy lines, being everywhere at once, sowing confusion and disarray. The "cyber-" prefix is derived from cybernetics and control theory, and suggests war "about knowledge - about who knows what, when, where, and why."
The parallels to the messy world of internet communications are immediately obvious, especially in terms of many-to-many networks:
Organizationally, the Mongols emphasized decentralized command in the field, unlike their foes who were generally required to wait for orders from their capitals. Yet by developing a communication system that kept their leadership apprised at all times, the Mongols enjoyed topsight as well as decentralization. The Khan "advanced his armies on a wide front, controlling them with a highly developed system of communication" - that was the secret of his success (Chambers 1985:43).
Having spoken to a small group of grad students at the UC Berkeley J-School this afternoon, I'm immediately reminded of this month's kerfuffle over the future of journalism. In one corner you've got Clay Shirky arguing that "old stuff gets broken faster than the new stuff is put in its place", while Charlie Gibson blames young people and the internet and hopes for One Big Website that could replace the content (and revenue) of the New York Times. Gibson here is like some unfortunate defender of a city under siege by foreigners with horses and bows, unable to understand how they reached so far so fast. What's interesting is that the invaders aren't even gunning for the citadel, they're just charging through. Individuals publishing online are cutting to the source of raw information, doing their own legwork and analysis, overrunning the central editorial expertise of the traditional newsroom with superior speed, maneuverability, and general unconcern with the consequences.
In strategic terms, the Mongols aimed first to disrupt an enemy's communications, then to strike at his heart. Unlike Clausewitz, they put little store in the need to destroy enemy forces before advancing. Also, Mongol campaigns were in no way "linear." They struck where they wished, when circumstances were deemed favorable. That their Christian and Muslim foes seldom emulated the Mongols' organizational and communication techniques is to their great discredit.
There is very little new under the sun, and the collision between old top-down power structures and young bottom-up ones seems like a cycle that will continue for some time. In particular, I'm unpersuaded by arguments such as Chris Messina's doe-eyed post on transparency and "generation open":
If we are Generation Open, then we are the optimistic generation. Ours only comes around every several generations with the resurgence of pure human spirit coupled with the resplendent realization of intent.
Chris writes about the raging boner he's developed for whatever it is that Facebook has going on the back burner with API's or something, but there's very little open or decentralized about the service. It is, ultimately, a giant directory that wants to be the middleman for all your basic communications with the people you care about, just like the "megacorporations" he blames for dropping cell calls on 9/11. What will happen now that they've seemingly decided to stop letting 80% of their messages fall to the floor?
Decentralization is not permanent change, and it's not ultimately a steady state: things get crystallized into increasingly-rigid structures, or they are allowed to drift apart. Decentralization is a tactic enabled by material detachment, a way to quickly conquer Europe or improve access to information. As the dust settles, new superstructures are built in an effort to consolidate gains and improve efficiency.
We're blessed to be experiencing a time of Big Tactics, when rapid motion and creative destruction set the tone and mobile burger treasure hunt is the order of the day. We have a president right now who just circumvented government structure entirely and made a Happy Nowruz video directly for the people of Iran, how crazy is that?
Mar 11, 2009 6:59am
maps from scratch
Yesterday, Shawn and I led a three hour E-Tech workshop called Maps From Scratch. Our goal was to step attendees through the creation of beautiful online cartography, from vector data to rendered images. We introduced a variety of tools and concepts, like shapefiles, spatial databases, Mapnik, and TileCache. One of the things that made this tutorial especially interesting for us was our use of Amazon's EC2 service, the "Elastic Compute Cloud" that provides billed-by-the-hour virtual servers with speedy internet connections and a wide variety of operating system and configuration options. Each participant received a login to a freshly-made EC2 instance (a single server) with code and lesson data already in-place. We walked through the five stages of the tutorial with the group coding along and making their own maps, starting from incomplete initial files and progressing through added layers of complexity.
Probably the biggest hassle with open source geospatial software is getting the full stack installed and set up, so we've gone ahead and made the AMI (Amazon Machine Image, a template for a virtual server) available publicly for anyone to use, along with notes on the process we used to create it. The AMI number is ami-df22c5b6, and you can find additional information on the (presently) bare bones website, mapsfromscratch.com.
Feb 21, 2009 9:11pm
walking papers
It'd be awesome to be able to mark up OpenStreetMap on paper, while walking around, and still have the benefit of something that others could trace when you're done. Right now, you can throw a GPS in your bag and upload your traces for others to turn into actual road data. If you mark your notes on paper, though, it's a more tedious and lonely process to get that data into the system. For U.S. users, most of the raw roads are in the system already. Largely, what's left to be done consists of repositioning sloppy TIGER/Line roads and adding local detail like parks, schools, zoning, and soon addresses.
It'd be interesting for generated printouts of OSM data to encode enough source information to reconnect the scanned, scribbled-on result back with its point of origin, and use it as an online base map just like GPS traces and Yahoo aerial imagery.
A round trip through the papernet.
You might print out something that looks like this:
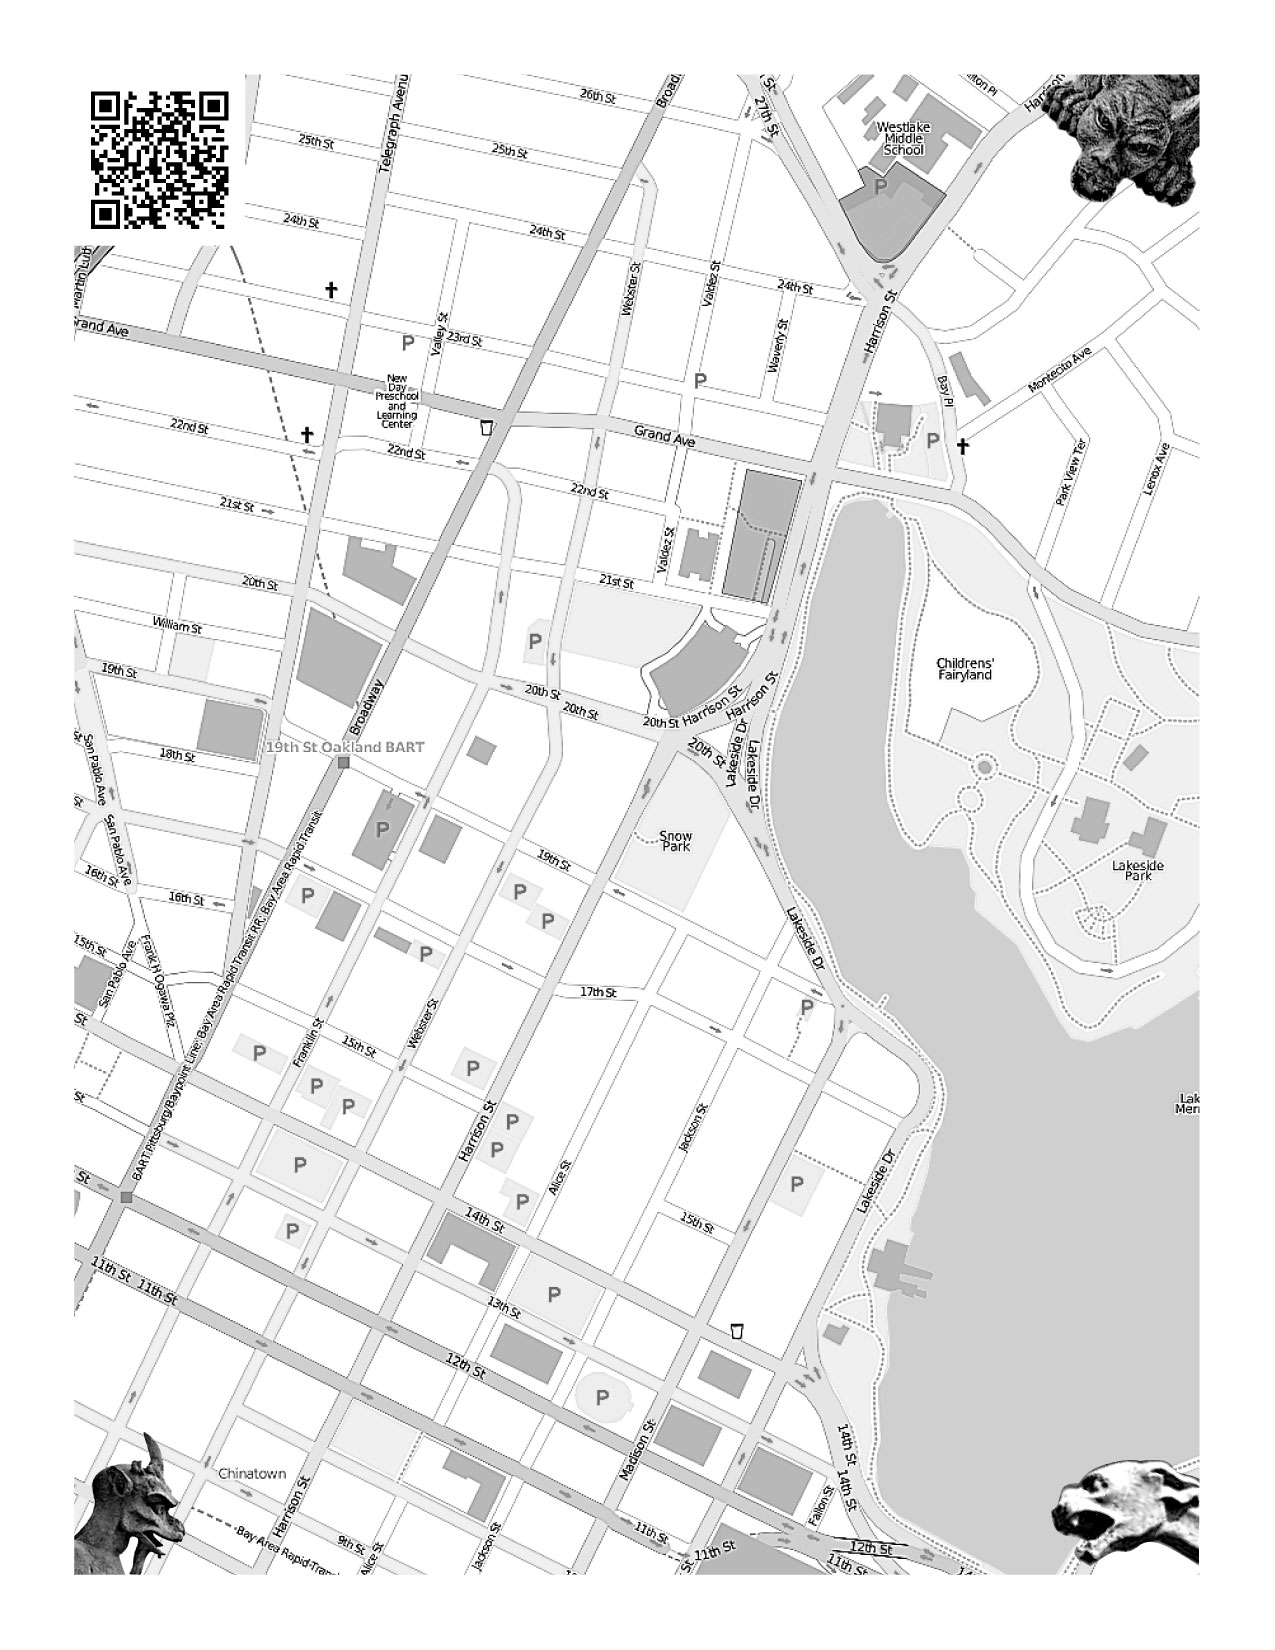
Maybe you'd print out a bunch of them, one for each neighborhood where you'll be walking and making local notes. You could fold them up and stick them in your pocket, photocopy them for other people, whatever. When you were done, you'd scan them in and a web service would figure out where the map came from, and make it available as a traceable base layer in Potlatch or JOSM.
How would the service know where the map came from?
I've been looking at SIFT (Scale Invariant Feature Transform), a computer vision technique from UBC professor David Lowe. The idea behind SIFT is that it's possible to find "features" in an image and describe them independently of how big they are, or whether they've been rotated.
That's why the picture above has gargoyles in the corner.
They don't have to be gargoyles, they just have to look unique enough so you could tell them apart and recognize them separately from the map. SIFT can look at an original image, and find features in it like this:

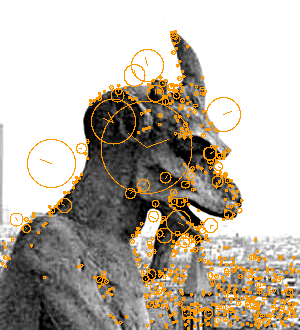
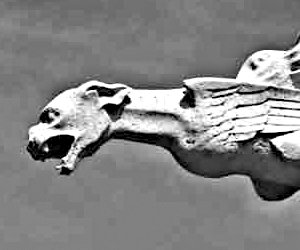
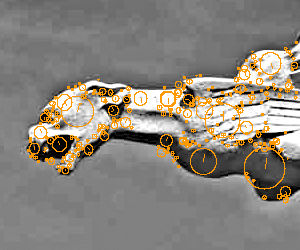
Check out the examples in Lowe's paper - he describes how detected features can be used to reconstruct entire objects.
When a new scan is uploaded, SIFT finds all three gargoyles and then it knows exactly where the corners of the original image are, even if the person scanning it did it upside or sideways. It also knows where to find the QR barcode, the square thing that looks like static in the top left corner. Aaron's been thinking about QR codes for at least two years now, and he's got a simple decoder ring webserver that he banged together out of Java. The code would say something simple like "this map came from 37d48'N, 122d16'W", and that would be just about enough to make the scan into a base map that people could trace in an OpenStreetMap editor.

I got an implementation of SIFT from Andrea Vedaldi and Brian Fulkserson, computer vision students at UCLA. Their implementation makes .sift files like this one or this one. The code to read them isn't over complicated once you know what all the numbers mean - here's a short script, markup.py, that reads the first four values from each line of a .sift file (x, y, scale, rotation) and draws a little circle on the source image. Easy. The remaining 128 numbers on each line are like a signature, you can determine whether features from two different images are the same thing by looking at a simple squared, summed distance between the two.
Of course, it's also possible to forego SIFT entirely and pay random strangers a tenth of a penny to find gargoyles for you, or just have the people uploading the scanned maps point them out.
All that's left is to build the thing to do the stuff. =)
Feb 20, 2009 9:10am
speaking
I've got a bunch of things coming up where they put me in front of groups of people and I talk about stuff that I'm interested in (caution: mostly maps at the moment).
Stanford
Just about 11 hours from now, Tom and I will be doing this week's CS547 Human-Computer Interaction Seminar, thanks to an invitation from Jeff Heer.
E-Tech
On Monday, March 9, Shawn and I lead a three hour workshop at O'Reilly's annual E-Tech conference, entitled Maps From Scratch. We'll be doing a full-stack review of open source geographic software for data and design, along with a bit of Stamen's pushing of this particular envelope. We'll try not to mention the G-word if possible: DIY is the point here. Later that week, Eric will do an hour-long conference session on reaching through maps: similar topic area, but much more emphasis on Stamen's work and very little hands-on.
SXSW
I will celebrate the Ides of March in style with Andrew Turner, David Heyman, and Elizabeth Windram. The panel is Neocartography, and with luck 10:30am isn't crazy-early for conference goers. I've never been to Austin before, I hope the extremely tenuous-sounding hotel reservation I made through the SXSW web app doesn't leave me here begging for floor space in a week.
Where 2.0
I'm not sure if the schedule for this one is up yet, but it's in May and I'll be doing a one-person session on Flea Market Mapping. This will be a recap of the historical geography I've been exploring here on the blog, though May is a long time away and I might come up with some entirely new stuff to shoehorn into that title.
Feb 11, 2009 8:30am
sky movies
These are the two most affecting things I've seen in 2009.
The first is a video from James Leng, something I saw on Aaron's delicious feed:

It's a timelapse video, recorded through the window of a half-empty flight traveling from Amsterdam to San Francisco. Turns out James is a friend of Sha's, and the video probably made its way over due to our work on Flickr Clock.
Here's what I had to say about it on the comments page:
The stars are actually the bit I find most interesting: seeing cities whoosh by like that, while the stars in the background remain mostly still reminds you who's really moving out there.
(that bit made it into the Guardian piece too)
The second came via Ori, and similarly records the night sky in motion:
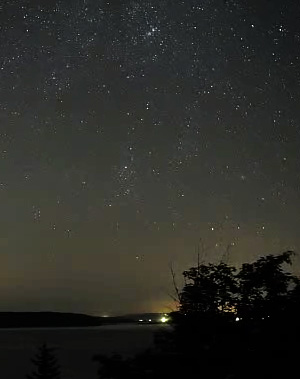
This one spans an entire night, somewhere on the coast of Maine, possibly by someone named Till Credner. The camera pans slowly from left to right, and on a few occasions planes stream by overhead. One of these planes might be James heading for California.
What ties these together is the visible relative motion of the stars. The earthbound video shows the entire dome of the sky turning slowly, while the airplane video shows the stars eerily standing still as the landscape moves below them. I'm reminded of Edwin Hutchins's explanation of the sidereal compass and alternative frames of reference in Cognition in the Wild:
Picture yourself on a Pulawat canoe at night. The weather is clear, the stars are out, but no land is in sight. The canoe is a familiar little world. Men sit about, talk, perhaps move around a little within their microcosm. On either side of the canoe, water streams past, a line of turbulence and bubbles merging into a wake and disappearing into the darkness. Overhead there are star, immovable, immutable. They swing in their paths across and out of the sky but invariably come up again in the same places. ... Everything passes by the little canoe - everything except the stars by night and the sun in the day.
I think if there's a broad class of subjective experience I find most addictive, it's the perspective shift connected to a sudden adjustment in point of view. The perception of the stars as motionless with the earth swinging through them can be just barely glimpsed in these short clips, similar to Patrick Farley's allegedly-Chillits-inspired 1998 strip Overheard At The Rave. One of my goals for 2009 is to vacation in a place with proper dark skies. Natural Bridges, or maybe the nearby Joshua Tree.
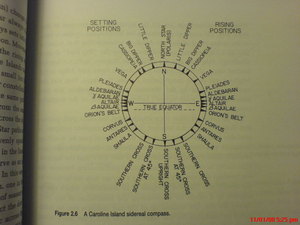
Jan 16, 2009 9:05am
blog all dog-eared pages: the process of government

Arthur F. Bentley's 1908 The Process Of Government (A Study Of Social Pressures) found me through a a review in the New Yorker a few months ago. This summary got me interested:
The Process of Government is a hedgehog of a book. Its point - relentlessly hammered home - can be stated quite simply: All politics and all government are the result of the activities of groups. Any other attempt to explain politics and government is doomed to failure. It was, in his day as in ours, a wildly contrarian position. Bentley was writing The Process of Government at the height of the Progressive Era, when educated, prosperous, high-minded people believed overwhelmingly in "reform" and "good government," and took interest groups to be the enemy of these goals.
Normally I summarize the books I read, but in this case Nicholas Lemann's review is a much better and more interesting writeup than I can offer. Instead I'll just mention that it's a delivery mechanism for the kind of worldview that burrows its way into your subconscious and won't let go. I have a weakness for reductive explanations, and Bentley offers a big one: "ideas", "the public", "zeitgeist", and other hive-mind explanations of political activity are meaningless in the face of often-temporarily organized interests arrayed in groups of people, playing a species-wide game of king of the hill. Law and morality exist because they are useful and helpful to someone, somewhere, more than they are harmful. When these things fall out of kilter, organizations form to rebalance them.
Read the review, check out the passages below, and then try to celebrate Tuesday's inauguration, read a political blog, watch Milk, follow Tim O'Reilly's losing battle to define "web 2.0", bemoan the passage of Prop. 8, or digg (something) for (some reason) without seeing groups, groups, groups, and groups all vying for your attention and support.
Page 13, on reform, opportunity, the absence of personal change:
What was to be seen, in actual human life, was a mass of men making of their opportunities. The insurance presidents and trustees saw opportunities and used them. Their enemies in the fit time saw opportunities and used them. The "public" by and by awoke to what it had suffered, saw its opportunities for revenge and for future safeguard and used them. All these things happened, all of them had causes, but those causes cannot be found in a waxing and waning and change or transformation of the psychic qualities of the actors.
Page 58, Rudolf von Jhering on the usefulness of law:
He set himself in opposition on the one hand to theories which made laws take their origin in any kind of absolute will power, and on the other hand to theories which placed the origin in mere might. It was the usefulness of the law, he said, that counted.
Stripped of terminology and disputation, this came to saying that you cannot get law out of simple head work, and you cannot get it out of mere preponderance of force; law must always be good for something to the society which has it, and that quality of being good for something is the very essence of it.
The formal element of the law he placed, at this time, in the legal protection by right of action ("Klage", "Rechtsschutz"); the substantial element in "Nutzen", "Vortheil", "Gewinn", "Sicherheit des Genusses". He defined laws as legally protected interests, and said that they served "den Interessen, Bed�rfnissen, Zwecken des Verlkhes". The "subject" of the law, using the term habitual among the jurists, is the person or organization to whom its benefits pass. The protection of the law exists to assure this benefit reaching the right place.
Page 113, on beef, alternatives, and inevitability:
To take an illustration of a kind most unfavorable for my contention: Does anyone believe that a states'-rights Bryan in the president's chair could have taken any other course in dealing with the nation-wide beef industry when the time for its control had arrived than was taken by a republican? ... But given the national scope of the industry and its customers, given also its foreign trade, given the emergency for its control which was bound to come through its own growth and methods, if not in one year then in another, given presidential representation of the mass of the people on approximately the same level, could a states'-right president have found a different solution from any other president? The answer is most decidedly, No.
Page 169, on the social rootedness of emotion:
No matter how generalized or how specific the ideas and feeling are which we are considering, they never lose their reference to a "social something". The angry man is never angry save in certain situations; the highest ideal of liberty has to do with man among men. The words anger and liberty can easily be set over as subjects against groups of words in the predicate which define them. But neither anger, nor liberty, nor any feeling or idea in between can be got hold of anywhere except in phases of social situations. They stand out as phases, moreover, only with reference to certain position in the social situation or complex of situations in the widest sense, within which they themselves exist.
Page 181, on what material to study if not ideas:
When our popular leader - to revert to the Standard Oil illustration - gets upon the platform and tells us we must all rally with him to exterminate the trusts, we have so much raw material for investigation which we must take as so much activity for just what it is. If we start out with a theory about ideas and their place in politics, we are deserting our raw material even before we take a good peep at it. We are substituting something else which may or may no be useful, but which will certainly color our entire further progress, if progress we can make at all on scientific lines.
Page 197, on social activity as the raw material:
We shall find as go on that even in the most deliberative acts of heads of governments, what is done can be fully stated in terms of the social activity that passes through, or is reflected, or represented, or mediated in those high officials, much more fully than by their alleged mental states as such. Mark Twain tells of a question he put to General Grant: "With whom originated the idea of the march to the sea? Was it Grant's or was it Sherman's idea?" and of Grant's reply: "Neither of us originated the idea of Sherman's march to the sea. The enemy did it;" an answer which points solidly to the social context, always in individuals, but never to be stated adequately in terms of individuals.
Page 206, on acting groups:
There is ample reason, then, for examining these great groups of acting men directly and accepting them as the fundamental facts of our investigation. They are just as real as they would be if they were territorially separated so that one man could never belong to two groups at the same time. ... Indeed the only reality of the ideas is their reflection of the group, only that and nothing more. The ideas can be stated in terms of the groups; the groups never in terms of the ideas.
Page 211, on groups, activity, and interests:
The term "group" will be used throughout this work in a technical sense. It means a certain portion of the men of a society, taken, however, not as a physical mass cut off from other masses of men, but as a mass activity, which does not preclude the men who participate in it from participating likewise in many other group activities. It is always so many men with their human quality. It is always so many men, acting, or tending toward action - that is, in various stages of action. ... It is now necessary to take another step in the analysis of the group. There is no group without its interest. An interest, as the term will be used in this work, is the equivalent of a group.
Page 227, on the source of group strength:
There is no essential difference between the leadership of a group by a group and the leadership of a group by a person or persons. The strength of the cause rests inevitably in the underlying group, and nowhere else. The group cannot be called into life by clamor. The clamor, instead, gets its significance only from the group. The leader gets his strength from the group. The group merely expresses itself through its leadership.
Page 347, on the deception of appearances:
Taking all the conditions, it would have been natural to expect that the tariff movement would have found a leader in Roosevelt, and have made a strong struggle through his aid, which, of course, is just what has not happened up to date. And the reason for this is exceedingly simple. It is not that Roosevelt "betrayed" the cause nor that he sacrificed it to the "trusts", but that under present conditions, despite all superficial appearances, there is not an intense enough and extensive enough set of interest groups back of the movement to make a good fight for thoroughgoing reform with reasonable prospects of success.
Page 348, on subsurface movements:
The essential point in an interpretation of government concerns the great pressures at work and the main lines of the outcome. It is relatively incidental whether a particular battle is fought bitterly through two or more presidencies, or whether it is adjusted peacefully in a single presidency, so long as we can show a similar outcome. This is true because the vast mass of the matter of government is not what appears on the surface in discussions, theories, congresses, or even in wars, but what is persistently present in the background. It is somewhat as it is when twenty heirs want to contest a will, but have only a single heir apparent in the proceedings, while the other nineteen hang back in the shadow. The story will concern the fight of the one; but the reality concerns the silent nineteen as well.
Page 418, on the inadequacy of policy to explain political parties:
Like all "theory", policy has its place in the process as bringing out group factors into clearer relation, and as holding together the parties, once they are formed, by catchwords and slogans. So far as it gives good expression to the groups on its particular plane, all is clear. But to attempt to judge the parties by their theories or formal policies is an eternal absurdity, not because the parties are weak or corrupt and desert their theories, but because the theories are essentially imperfect expressions of the parties.
The vicissitudes of states' rights as a doctrine are well known enough. Another passing illustration concerns the government regulation of commerce. If we may identify the commercial interests of a century ago with those of today for the purposes of illustration, we find that the very elements which then under Hamilton's leadership were most eager to extend the power of government over commerce are now the most bitterly opposed to any such extension. Then and now the arguments made great pretenses to logic and theoretical cocksureness, and then, as now, the theories were valuable in the outcome only as rallying the group forces on one side or the other for the contest.
Page 432, on writing legislation yourself:
Still more striking if the organization which at times can be found which produces what may almost be described as substitute legislatures. When there is some neglected interest to be represented, when the legislature as organized does not deal on its own initiative with such matters, when a point of support in party organization can be found - a point let us say of indifference, at which nevertheless the ear of some powerful boss can be obtained - a purely voluntary organization may be formed, may work out legislation, and may hand it over completed to the legislature for mere ratification.
Page 440, on leadership and personality cults:
A leader once placed will gather a following around him which will stick to him either on the discussion level or on the organization level within certain limits set by the adequacy of his representation of their interests in the past. That is, as a labor-saving device, the line of action in question will be tested by the indorsement of the trusted leader. The leader may carry his following into defeat in this way, but that very fact helps to define the limits of the sweep of groupings of this type.
Page 441, on the primacy of groups over forms of government:
The citizen of a monarchy who sees his kind ride by may feel himself in the presence of a great power, outside of him, entirely independent of him, above him. The man busy in one of the discussion activities of the time may look upon ideas as masterly realities self-existing. But neither ideas nor monarchs have any power or reality apart from their representation of reflection of the social life; and social life is always the activity of men in masses.
Page 442, on leadership and esprit de corps:
Not only are discussion groups and organization groups both technique for the underlying interests, but within them we find many forms of technique which shade into each other throughout both kinds of groups. In the older fighting, soldiers might sing as they went into battle, or an officer might go ahead waving the colors. The singing and the officer illustrate the technical work of the representative groups. They serve to crystallize interests, and to form them solidly for the struggle, by providing rallying points and arousing enthusiasm. For all that, it is the men organized behind the singing, the cheering, and the colors that do the fighting and get the results.
Jan 3, 2009 9:30am
programming: like pulling teeth
Tom linked to this 2002 conversation between Kent Beck (programmer) and Alan Cooper (interaction designer), "Extreme Programming vs. Interaction Design":
Kent Beck is known as the father of "extreme programming," a process created to help developers design and build software that effectively meets user expectations. Alan Cooper is the prime proponent of interaction design, a process with similar goals but different methodology. We brought these two visionaries together to compare philosophies, looking for points of consensus - and points of irreconcilable difference.
So they reach one point of irreconcilable difference about midway through:
Beck: OK, wait. I agreed with you very close to 100 percent, then you just stepped off the rails. I don't see why this new specialist has to do his or her job before construction begins?
Cooper: It has to happen first because programming is so hellishly expensive and the cost of programming is like the cost of pulling teeth. ... Building software isn't like slapping a shack together; it's more like building a 50-story office building or a giant dam.
Beck: I think it's nothing like those. If you build a skyscraper 50 stories high, you can't decide at that point, oh, we need another 50 stories and go jack it all up and put in a bigger foundation.
Cooper: That's precisely my point.
Beck: But in the software world, that's daily business.
Cooper: That's pissing money away and leaving scar tissue.
The interview might as well stop there, because this is the One, Central, Insurmountable difference between these two approaches toward development work. XP is adapted to a context where motivation is expensive and change is cheap. Interaction design (at least how Cooper explains it) is adapted to a context where motivation is cheap and change is expensive. It should be obvious that contexts of both kinds can exist in the world: there are situations where it's easy to return to previous decisions and modify them (software, for one), and there are other situations where it's not (e.g. buildings, dams).
I think in this particular case, Cooper is pretty much wrong. They're talking about software, so we know that change is relatively cheap in the context of this conversation - cheaper than buildings, anyway. They just start to touch on the way in which running code becomes an object to think with, a thing to learn from: "you can build a program that improves with age instead of having it born powerful and gradually degrading" (Beck). Cooper believes that it's possible to suss out requirements and desires by talking to people about what they want and getting sign-off on a promise, but experience shows that people's desires change in response to novelty. Henry Ford's "faster horse" line comes to mind, as does perpetual beta wunderkind Flickr: starting with something that works enough to elicit use and reaction trumps big, up-front design when your changes are low cost. There are contexts where change is high-cost: skyscrapers, movies, mass-produced objects. Software, especially the astounding percentage of the world's software that's written by companies for their own internal use, is not one of them.
subscribe to ![]() this site.
|
contact Michal Migurski
this site.
|
contact Michal Migurski