tecznotes
Michal Migurski's notebook, listening post, and soapbox. Subscribe to ![]() this blog.
Check out the rest of my site as well.
this blog.
Check out the rest of my site as well.
Aug 26, 2009 7:14am
tile drawer, round one
For better or worse, Mapnik has long had a reputation for being difficult to install. Ditto OSM planet dumps. I know and you know this is not true, but just because Dane has done so much work to drastically simplify the process doesn't mean you want to do it yourself, like how people stopped soldering their own MP3 players when the iPod came out.
Meanwhile, Amazon has a thing called EC2, the Elastic Compute Cloud, and it's amazing, really one of the biggest changes to my work as a technology/research/CTO guy. One of the things you can do with an elastic compute cloud is to create templates for new machines, and let other people run them. So you put these things together, and you get the Tile Drawer.
Tile Drawer is a new thing I've been working on that makes it fast and easy to run an OpenStreetMap tile server on Amazon's infrastructure for ten cents per hour, with just about no configuration at all. When you instantiate the Tile Drawer AMI (ami-e1ea0a88) you provide two bits of information:
- The geographical bounding box of an area you'd like maps for, and
- a Cascadenik stylesheet for how it should look.
Your new instance will boot itself up, and immediately start pulling down OpenStreetMap data to render map tiles with. This is pretty much the whole story.
I have a couple example stylesheets up for your use, and I'm very interested in adding more. I'm excited by the idea of a community-maintained collection of cartographic styles, all of which can be immediately applied to any geographic location covered by OpenStreetMap. I'm also excited by the idea that designers can create and rapidly use new kinds of map renderings - we've been plumbing the depths of customized Mapnik renderings for a few years, and it's time to see it break out into wider use. We're already seeing beautiful new map designs like Craig Mod's Art Space Tokyo book, Wilson Miner's EveryBlock maps, and Matt Jones's Lynchian_Mid Cloudmade style for Dopplr. There should be more.
The availability of the OpenStreetMap data set itself is a whopping great slab of social surplus. What did people do when you still needed to get someone from NavTeq or TeleAtlas on the phone for an indeterminate amount of money when you wanted some map data? I was hearing from new Google friends at the Camp Roberts thing a few weeks back that even they reach for OSM when they need to experiment. It's so simple, the whole thing is available, all the time, with regular updates. I'm hoping to see it continue to gradually replace other source of map data for normal, day-to-day city navigation use.
There are a few things that Tile Drawer does not do yet, because it's new. For example, it does not keep up to date with OSM updates. Since it's so cheap and easy to fire up additional instances, I'm imagining that this need can be addressed for the moment by periodically creating replacement Tile Drawers and killing old ones. It doesn't serve anything other than OpenStreetMap data. It doesn't do WMS. It doesn't render multiple styles at once. None of these things seem important yet, which doesn't mean they won't happen at some point in the future.
But first go check out Tile Drawer.
Aug 23, 2009 4:09am
geological training wheels
David Smith has an excellent post on Dunwich, Suffolk that ties together several historical and paleontological threads connected to the town and the North Sea generally.
Some excerpts of excerpts:
The town was losing ground as early as 1086 when the Domesday Book, a survey of all holdings in England, was published; between 1066 and 1086 more than half of Dunwich's taxable farmland had washed away. Major storms in 1287, 1328, 1347, and 1740 swallowed up more land. By 1844, only 237 people lived in Dunwich.
Also:
The British continental shelf contains one of the most detailed and comprehensive records of the Late Quaternary and Holocene landscapes in Europe. This landscape is unique in that it was extensively populated by humans but was rapidly inundated during the Mesolithic as a consequence of rising sea levels as a result of rapid climate change.
And:
In 10,000 BC, hunter-gatherers were living on the land in the middle of the North Sea. By 6,000 BC, Britain was an island.
This and the Bering land bridge make me think of slow movements that stretch out the bounds of possibility. Imagine living on the North Sea plain as it fills in with water over a period of four thousand years. For a few generations, you can move freely from east to west and back. Soon, rivers and marshes might start to creep in and eventually the two landmasses are separated, but still within a short row of each other.
The psychological space between the two coasts starts small; it's understood that the water boundary between is easily surmountable because it's just the equivalent of a creek or a bay. As the separation grows, the mental model of the growing North Sea continues to flag it as a path rather than a wall, you just have to improve your transportation technology periodically to continue moving back and forth. This is like learning to ride a bike with training wheels: you get used to the idea of being upright while you have a shim in place, then as the shim goes away you learn to remain upright on your own. Keep moving, balance with the handlebars. Skills that appear impossible to learn are acquired through the use of now-gone crutches.
Look at this map that Matthew Hurst posted today:
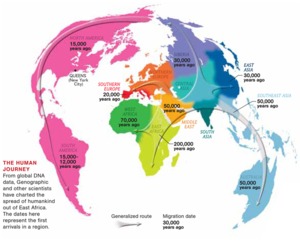
You can see a 50,000 year gap between settlements on either side of the 8 mile wide Strait of Gibraltar. There's no such gap between England and the continent, those places started out settled together, and remained so even after the Holocene split. The now-submerged floor of the North Sea was like a set of prehistoric training wheels, helping to mark the path to Britain as a possibility and encouraging the upkeep of technology to keep it so. The always-divided Strait of Gibraltar did no such thing. Knowing that something is possible makes it seem sane to work to attain it. Believing that something is easy can have the same effect: "I once asked Ivan, 'How is it possible for you to have invented computer graphics, done the first object oriented software system and the first real time constraint solver all by yourself in one year?" And he said "I didn't know it was hard." Moore's law in computer development is like this as well, establishing a base rate of expectation to guide the frantic pace of development for decades afterward.
Anyway.
Aug 22, 2009 7:02pm
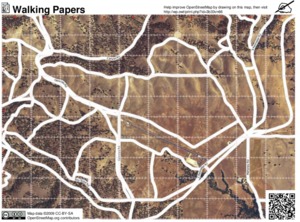
walking papers localization
I'm super happy to say that Walking Papers Issue #9 has just been closed, thanks to the invaluable help of Jonas Kreukel and Milo van der Linden, who graciously volunteered to translate the entire site into German and Dutch, respectively. This is my first venture into a completely-localized site, and it's now set up to allow other volunteer translators to offer their own languages. Poland, France, and Italy currently hold the 4th, 5th, and 6th position in the country zeitgeist, any takers?
Aug 17, 2009 4:40pm
pick us for sxsw 2010
It's panel picker season again. Here's us:
Maps, Books, Spimes, Paper: Post-Digital Media Design
The Internet is situated in the real world, and interesting experiences have to blend physical and digital. Mixing new technology - Arduinos, GPS, RFID, QRcodes - and old (web, paper), we present examples of the recently possible future, and the lessons we've learnt. And we'll make something along the way.
- Chris Heathcote (meta loca)
- Aaron Straup Cope (Flickr)
- Michal Migurski (Stamen)
- Ben Terrett/Russell Davies (RIG)
- James Bridle (Bookkake)
Create a SXSW account if you haven't already and give us a thumbs-up. Here's another good one to vote for while you're there: God / Admin Interfaces with Gavin Bell, Matt Biddulph, and Kellan Elliott-McCrea. Now to go look through the remaining 2K+ panel ideas for interesting ones that haven't been specifically brought to my attention by friends...
Aug 10, 2009 5:05am
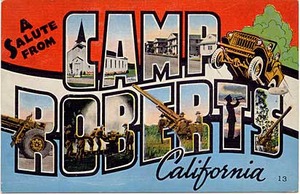
dispatch from camp roberts
Mikel has me beat with a series of four posts about our recent adventure to Camp Roberts near Paso Robles in Central California. Sean's also got a great run-down from Google's perspective.
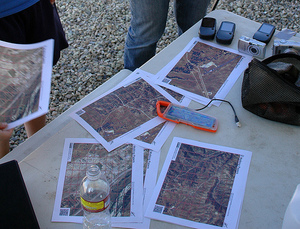
John Crowley of STAR-TIDES (Transportable Infrastructures for Development and Emergency Support) drew on a range of worldwide development talent to participate in a hypothetical Afghanistan disaster scenario, featuring remote location, unpredictable connectivity, limited time, and rapid assembly of geographic data from sources like UAVs and on-the-ground observation. Some of our co-participants included Google with accompanying Fusion Server, InSTEDD and their SMS-based geochat system, DevelopmentSeed's Drupal-based monitoring and coordination software, and my own dog in the fight, Walking Papers. The week served to validate many of the concepts sketched out in Aaron Cope's Papernet, and also helped to make the "paper" arrow in Mikel's own 2007 OSM dream napkin sketch point both ways.

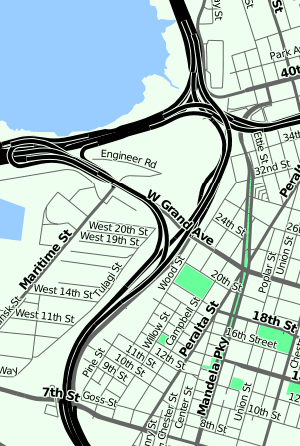
The rough workflow we settled on early in the week had aerial imagery sources at one end and OpenStreetMap at the other. Developer / geographer John Livni adapted Modest Maps ws-compose, an HTTP wrapper for generation of static images from tiled map sources, to use locally-provided inputs, transparent OpenStreetMap overlays, and reference grid lines for easier communication. Interns organized by the Naval Postgraduate School tested interim ideas out in the field.
Mikel Maron brought a local installation of the OpenStreetMap server, with which he was able to quickly supply a source and destination for geodata used in the project.
The immediate goal of the project was to provide world-traveler Todd Huffman with a portable Mac Mini installation of Afghan aerial imagery, a modified version of Walking Papers, Sahana, GeoCommons, Geochat, and other just-integrated software for remote experimental use in Nangarhar during the rapidly-approaching 2009 presidential election.
Interestingly, the event setting itself replicated many of the field conditions we might expect in the real world, most importantly a criminally spotty internet connection. This turned into an advantage, partially because we were able to ignore our usual distractions for a period of time, and also because we had made the fortunate choice to use Git earlier. Git was a serious champ here, making it possible to share source code repositories on a local network without losing global context but also without requiring an always-available connection to a central repository. I'm not going to waste too many words on Git advocacy, except to make the point that a good version control system lives and dies by the ecosystem of other tools built around it. I didn't move Stamen over to Subversion until I had seen Trac and all the ways it improved project communication. I also did not consider adopting Git until after I explored Github, the web-based "social coding" site. The killer feature for me was a way to follow others' projects, and graphical network view providing a visual history trail for each repository. Here are some example screen grabs showing views of the Walking Papers "paperwalking" repository from the same point in time, from three forked points of view:

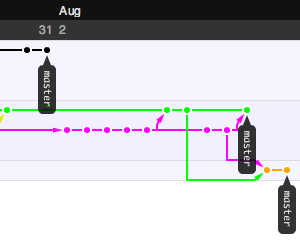
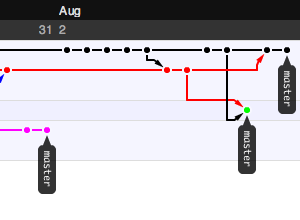
My Git use is still purely experimental, but I'm keeping a close eye on Matt Biddulph's Git links.
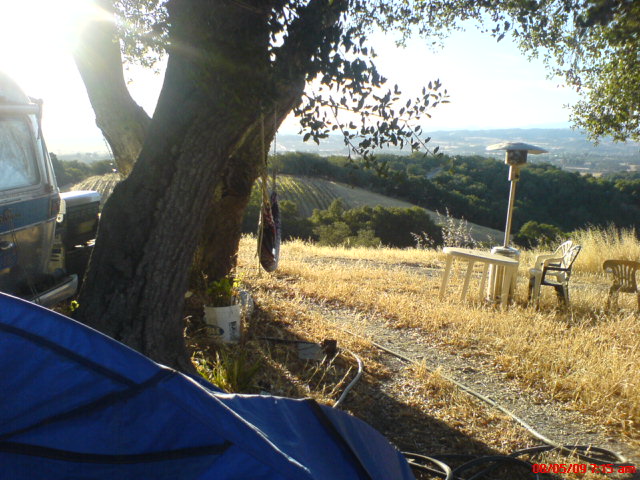
The other half of the week was a lovely camping spot provided by Josh's pal Steve Martell, whose Kaleidos Winery has some of the best rural views and good times I've yet experienced.
It was all a little bit of this...

...and a whole bunch of this.

subscribe to ![]() this site.
|
contact Michal Migurski
this site.
|
contact Michal Migurski