tecznotes
Michal Migurski's notebook, listening post, and soapbox. Subscribe to ![]() this blog.
Check out the rest of my site as well.
this blog.
Check out the rest of my site as well.
Oct 31, 2019 6:19pm
Mapping Remote Roads with OpenStreetMap, RapiD, and QGIS
I’ve been writing at Medium.com for the past year. Read this full original post there.
This tutorial was originally part of a joint workshop between DirectRelief, NetHope, and Facebook at the 2019 NetHope Global Summit in San Juan, PR.
The team I work with at Facebook has been busy releasing and updating RapiD, a version of the primary OpenStreetMap (OSM) iD editor that helps every mapper make fast, high-quality, and accurate edits using roads suggested by our AI-assisted road import process. We’ve been expanding OSM in countries like Thailand, Indonesia, and now Malaysia with a robot-assisted process that pairs advanced imagery processing to find likely roads in fresh aerial imagery with human oversight to confirm and add roads to OSM. Initially these tools were available internally but now they’re easy to use for anyone. In combination with up-to-the-minute OSM extracts it’s possible to integrate OSM into a GIS environment in a single session using just browser-based tools.
Check out a short video of RapiD in action, before and after robot-assisted road suggestions or read more about it on the OSM wiki.
In this tutorial I’ll show how to view robot-suggested additions to OSM with RapiD, save them to the map, get your data back out with Protomaps Extracts, and use the resulting data in QGIS. I’ll also show how RapiD can be used with popular OSM tools like Maproulette and HOT Tasking Manager, for when you want to help build the map but you’re not sure what to do.

Nov 3, 2018 4:00pm
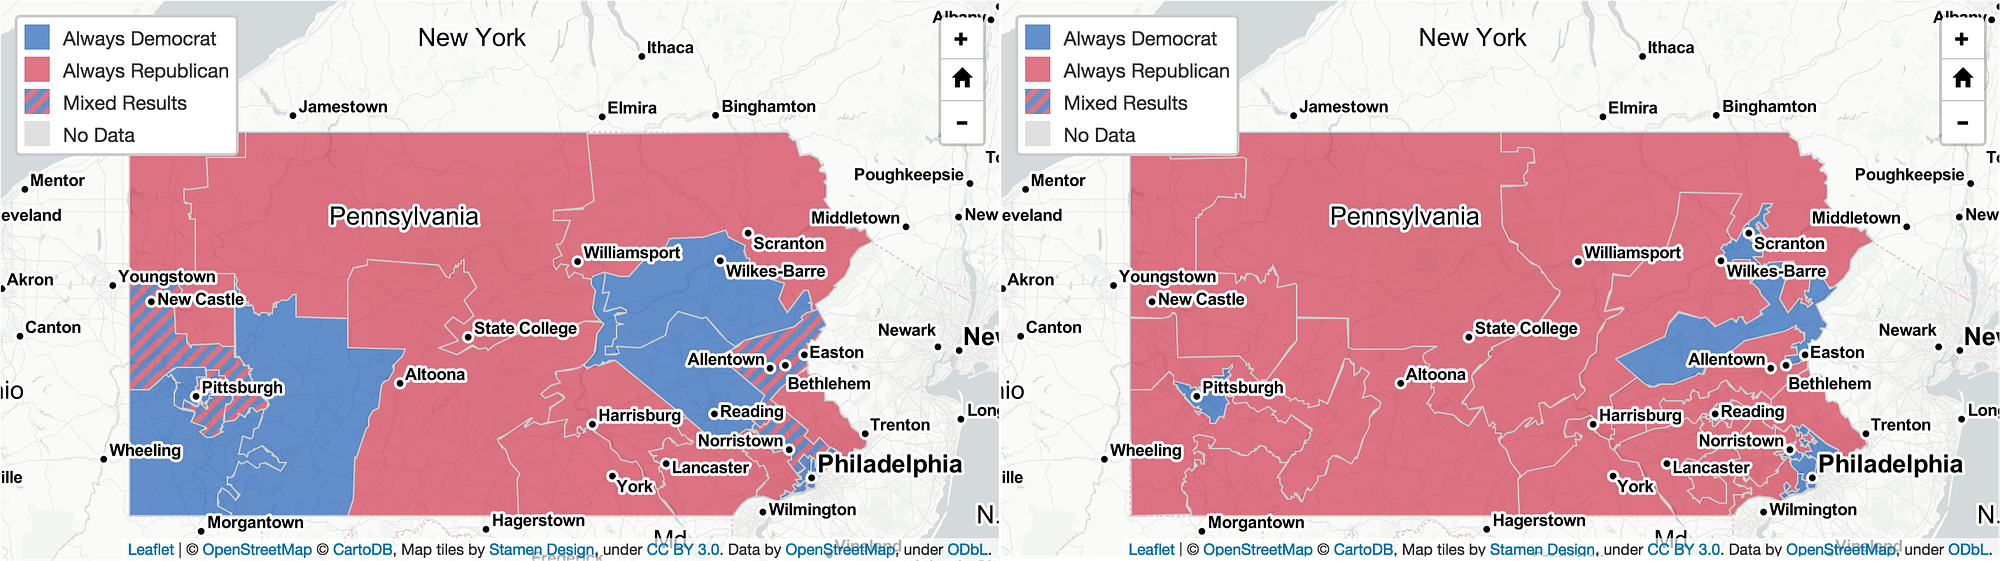
How It’s Made: A PlanScore Predictive Model for Partisan Elections
I’ve been writing at Medium.com for the past year. Read this full original post there.
With the mid-term elections in full swing and campaigns focused on the districts we have, PlanScore has had a quiet few months. Earlier in the year Pennsylvania redrew its U.S. House districts with a rush of competing plans submitted by participants from all over the state’s political landscape. PlanScore’s Nicholas Stephanopoulos reviewed them all using our models and described the process on the Election Law Blog. Last month, the Virginia General Assembly had until October 30 to pass a remedial map after a district court in Virginia struck down eleven House of Delegates districts on racial gerrymandering grounds. We scored those too, and Nick wrote about the process again.
After the 2018 mid-terms, we’ll be headed into a three-year Census and redistricting cycle redistricting cycle where all 50 states get new maps just like Pennsylvania and Virginia did in their special processes. In this post, I’ll describe how we make PlanScore’s prediction models to support that cycle and help ensure fair maps for every state.

Oct 17, 2018 4:00pm
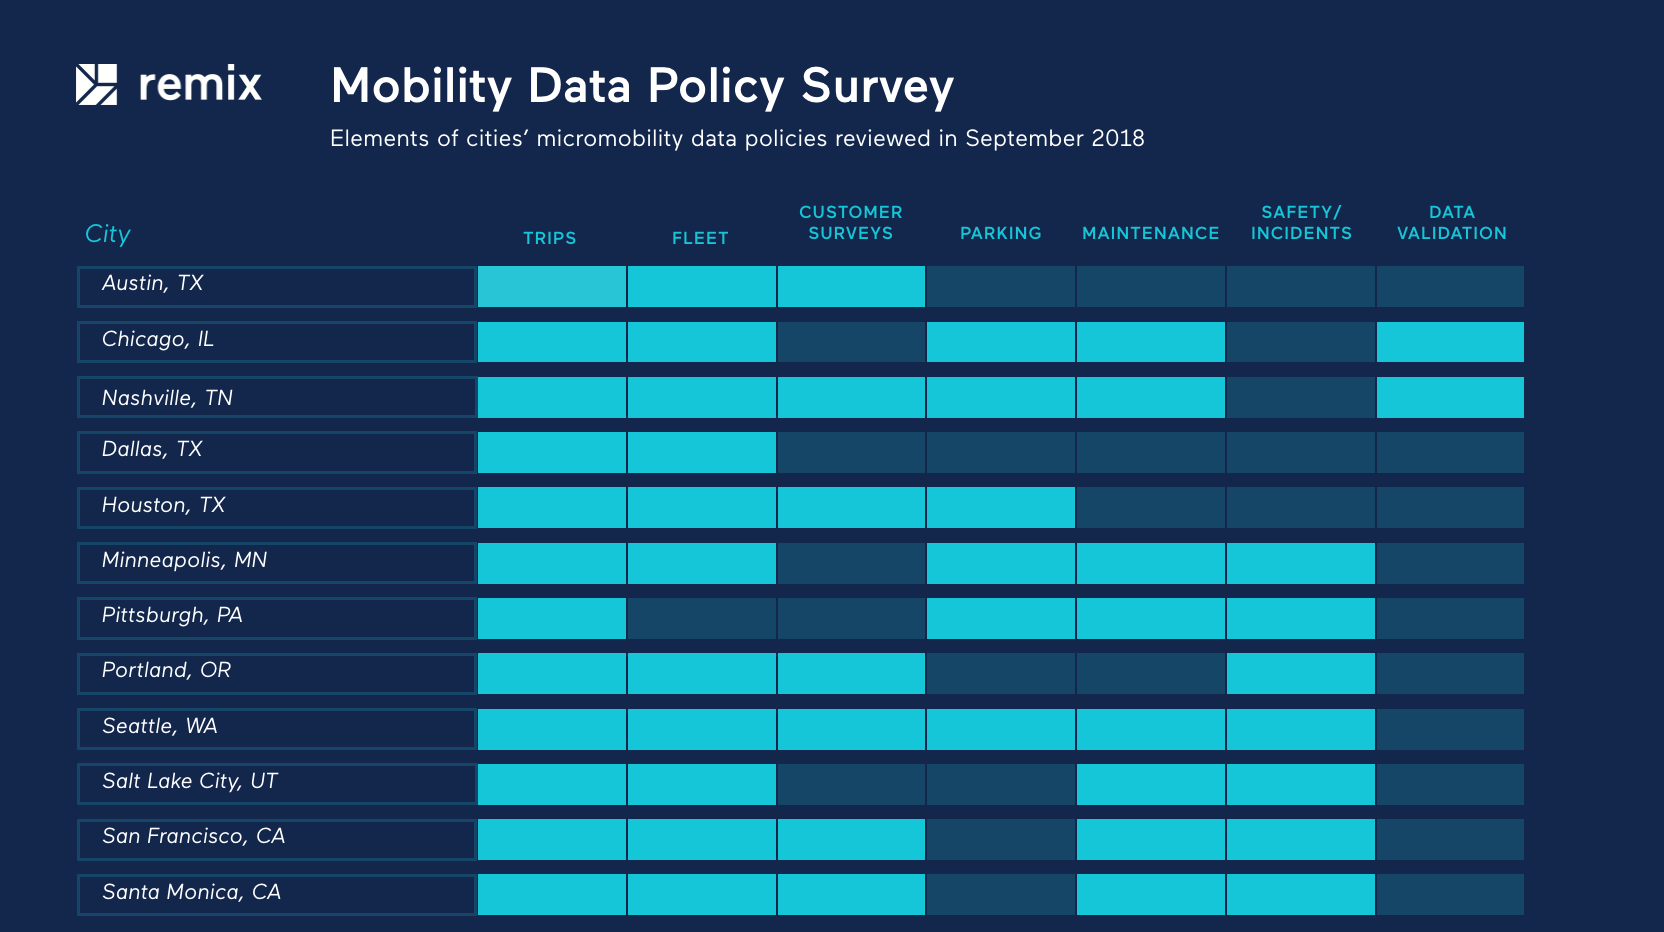
Micromobility Data Policies: A Survey of City Needs
I’ve been writing at Medium.com for the past year. Read this full original post there.
In the past year, cities have been prompted to rapidly re-examine the management and regulation of transportation services due to the influx of micromobility. This recent movement has illuminated major opportunities to expand transportation options while highlighting several challenges for widespread adoption and support. In the context of data, the conversation has evolved quite differently from TNCs just a few years ago. Cities are creating detailed data requirements for operators and are successfully obtaining that information as an input for smarter future transportation plans.
We surveyed over a dozen emerging micromobility data sharing policies in places like Nashville, Chicago, Seattle, Portland, Santa Monica, Dallas, San Francisco, Austin, Denver, Pittsburgh, Houston, Durham, Salt Lake City, and Chattanooga. These policies represent a combination of exploratory pilot programs, post-pilot permits, and even one emergency rule. Based on our research, we see these core data sharing policy features:
Apr 9, 2018 4:00pm
Open Precinct Data
I’ve been writing at Medium.com for the past year. Read this full original post there.
Several weeks ago, I spent an extended weekend at the fifth (of five) Geometry in Redistricting conference. Apart from speaking and participating in a panel on law, tech, and gerrymandering, organizer Moon Duchin asked for my help organizing the conference hackathon. One theme I heard repeated throughout the event centered on the difficulty of finding reliable precinct geography and election results.
There’s an opportunity here for a new data project focused on connecting existing academic and independent efforts with durable, unique, permanent identifiers for nationwide voting precincts. Imagine if you could easily correlate detailed voting results from OpenElections.net (OE) or state boards of elections with mapped polygons and census geography over time. We already know how effective a GEOID-based approach can be thanks to data published by the U.S. Census, but precincts are a special challenge without a current champion.
Feb 28, 2018 5:00pm
Scoring Pennsylvania
I’ve been writing at Medium.com for the past year. Read this full original post there.
On February 13 we launched PlanScore.org into the whirlwind of Pennsylvania’s disputed congressional plan. Our mission is to help citizens evaluate new redistricting plans for partisan skew and to elevate the conversation on partisan gerrymandering with new historical data for state and U.S. congressional district plans. It’s been an exciting couple of weeks. What did we learn, and how are we doing at reaching our goals?
Every district plan is designed to do a job: apportioning voters into Congressional districts so they can elect members to the U.S. House, typically following traditional redistricting criteria like compactness, contiguity, and preservation of communities and incumbents. Since 2010, we’ve seen the emergence of detailed computer models that allow for the creation of unfair, skewed maps that still conform to traditional criteria.
subscribe to ![]() this site.
|
contact Michal Migurski
this site.
|
contact Michal Migurski