tecznotes
Michal Migurski's notebook, listening post, and soapbox. Subscribe to ![]() this blog.
Check out the rest of my site as well.
this blog.
Check out the rest of my site as well.
Apr 6, 2017 6:17pm
building up redistricting data for North Carolina
The 2020 Decennial Census is getting closer, and activity around legislative redistricting is heating up. It’s normal for states to redraw lines in connection with the Census, but we’re also seeing legal challenges to Republican gerrymanders in states like Wisconsin, North Carolina, Virginia, and elsewhere. There’s a big opportunity here to look holistically at state district boundaries and their effects on votes, but it’ll only be possible with high-quality, detailed, and easily-accessible data about past votes. I’ve been working on a set of such data for North Carolina’s 2014 general election, and I’m publishing it in CSV, GeoJSON, and Geopackage formats.
Problems
Many common measures of district plan quality (like the efficiency gap for partisan outcomes or racial demographics for the Voting Rights Act) are quite intuitive, but we need a common set of facts to work from.
Right now, those facts are hard to get for a variety of reasons:
- Getting precinct-level geography data often requires 1-on-1 requests and local state knowledge, so it’s often only requested by journalists or researchers who need it for some specific project. Ryne Rohla’s recent to build a national precinct map of presidential races is a great example of this: “Hundreds of emails and phone calls and months of work later, here’s what I came up with… For a number of states, I had to create precinct shapefiles almost entirely by hand.”
- Other efforts like the LA Times California map echo Rohla’s, with duplicative and overlapping efforts to gather the same data. The U.S. Census ran a 2010 Voting Tabulation District shapefile program to assemble some of this data, but for predictive purposes the data should be more recent.
- Vote totals typically require manual or custom data entry. The Open Elections project (OE) is helping tremendously with this, offering a central space for unified data collection. OE’s efforts are resulting in a growing collection of cleanly-formatted vote totals.
- Some data must be imputed, or inferred from neighboring data. For example, votes in an uncontested legislative district with only a single major-party candidate can’t be used to predict how a competitive race would look in that district. You need data for other races and other districts to make educated guesses, and this is tricky.
I’ve been learning what I can about legislative district plans to determine how feasible it would be to gather such data and make it available to political staff, journalists, and members of the public for the upcoming wave of redistricting efforts. An easy-to-get and easy-to-use baseline of code and data for district plan fairness would make it possible for anyone to rapidly and accurately respond to a proposed plan. There’s a big opportunity here for an online, web-based tool that can do this but it’ll need data that’s not yet collected in one place.
North Carolina
A few weeks ago, I looked at partisan outcomes for randomized redistricting plans in Wisconsin based on the efficiency gap metric. I generated thousands of possible plans, and came up with predictions for outcomes based on Professor Jowei Chen’s randomized Florida redistricting paper. I’m using this work to support work on comprehensive databases of electoral data, such as the election geodata repo that Nathaniel Vaughn Kelso and I have been working on and Open Elections.
This week, I shifted my attention to another priority state, North Carolina. As Stephen Wolf points out in DailyKos,
It’s the only one with truly competitive races for president, Senate, and governor. Remarkably, though, not a single seat is expected to change hands in the state’s House delegation, where Republicans hold a lopsided 10-to-3 advantage over Democrats.
The 2014 general election featured over 40% unopposed State Senate seat elections. In 21 of 50 races, no one bothered to compete on one side.
North Carolina is also home to some jaw-dropping partisan racial shenanigans detailed in The Atlantic:
“In North Carolina, restriction of voting mechanisms and procedures that most heavily affect African Americans will predictably redound to the benefit of one political party and to the disadvantage of the other,” Motz wrote. “As the evidence in the record makes clear, that is what happened here.”
Overall, North Carolina looks like a state with artificial barriers erected by Republican lawmakers during a time when the overall state voting population is migrating leftward. The state’s U.S. Congressional district plan shows this cleary:
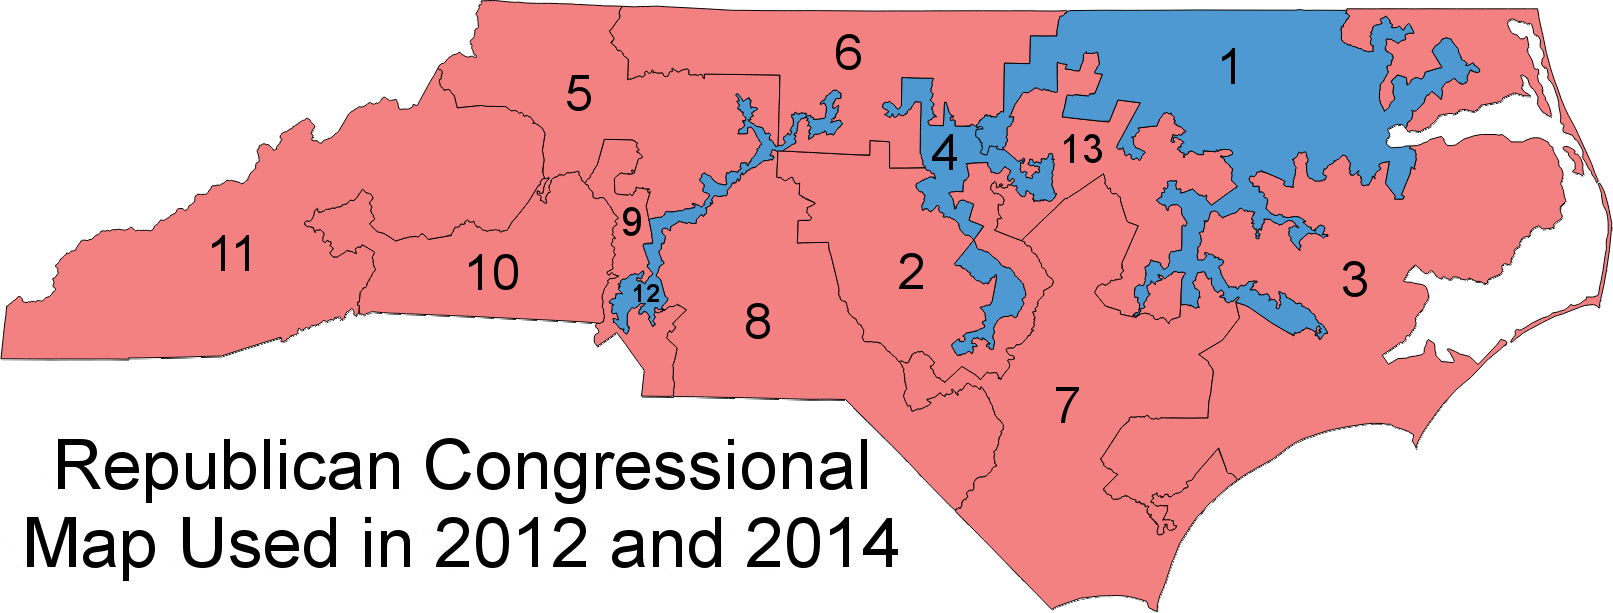
Stephen Wolf again:
Following the 2010 census, Republicans crammed as many Democrats as they could into just three districts, taking in parts of dark-blue Charlotte, Durham, Greensboro, Raleigh, and other cities, along with black voters in the rural northeast, almost all of whom vote Democratic. When Republicans couldn’t pack in Democrats from other liberal cities like Asheville in western North Carolina or Wilmington in the southeast, they cracked them between two seats containing other heavily Republican turf. With surgical precision, Republicans spread out their own voters almost perfectly evenly among the other 10 districts, making sure that none would be either blue enough to be vulnerable or too heavily tilted to the right such that Republican votes would “go to waste.”
New Data
Luckily, North Carolina also features excellent geographic and electoral coverage:
- Open Elections has precinct-level 2014 data
- Election Geodata has 2014 precinct geographies
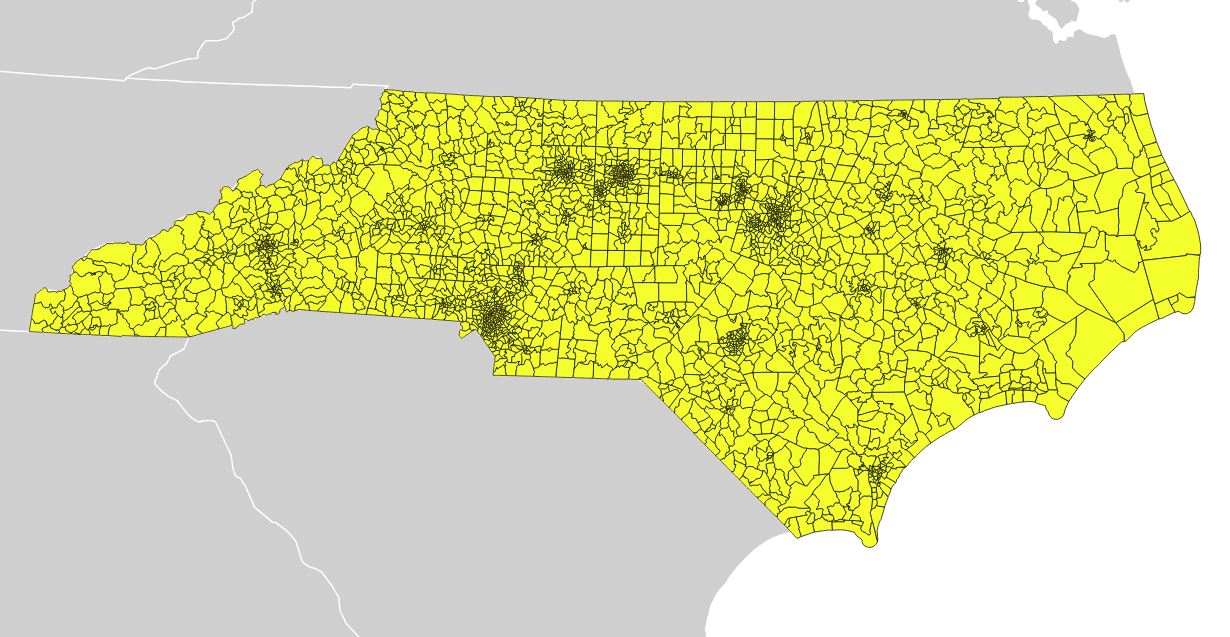
Taken together and combined with American Community Survey 2015 data from Census Reporter, it’s possible to generate a resonably accurate picture of 2014 voter behavior and demographic information for all 2,725 precincts in North Carolina:
- CSV file: nc_complete-2014.csv
- GeoJSON file: North-Carolina-2014.geojson.gz (9.2 MB compressed)
- Geopackage file: North-Carolina-2014.gpkg.gz (18.9 MB compressed)
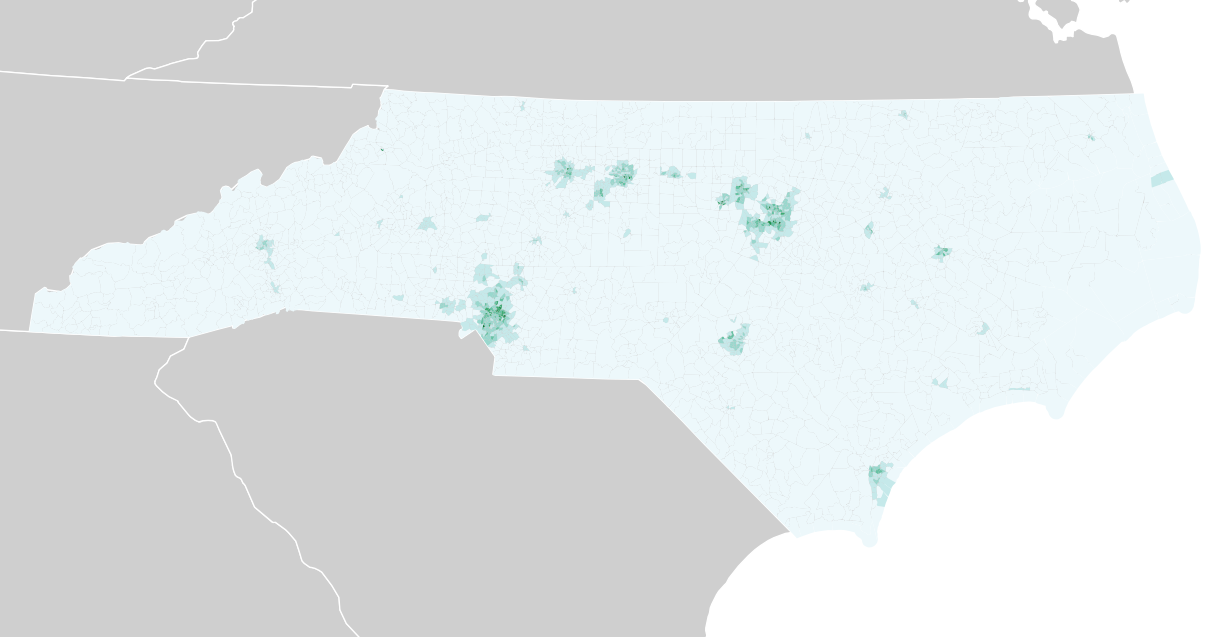
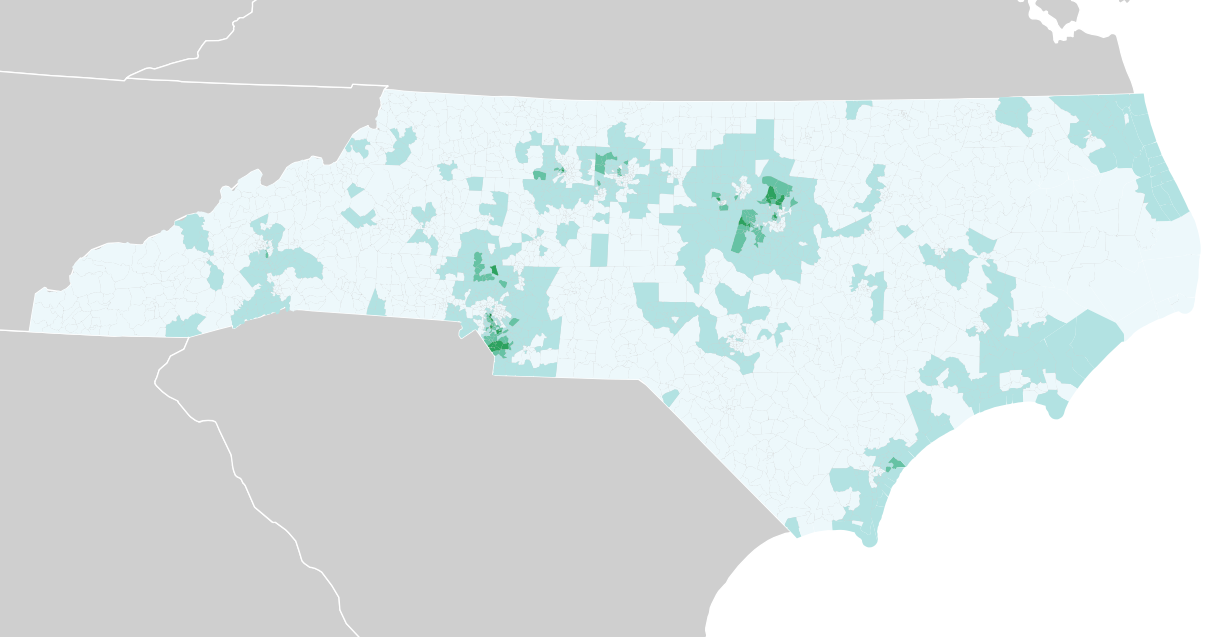
A quick look through the data illustrates some of the patterns in Stephen Wolf’s article. The population density is much higher around Raleigh and Charlotte, covered by the three Democratic districts in North Carolina’s current U.S. House district plan:
Variables like education level and income tend to cluster around those two areas as well:
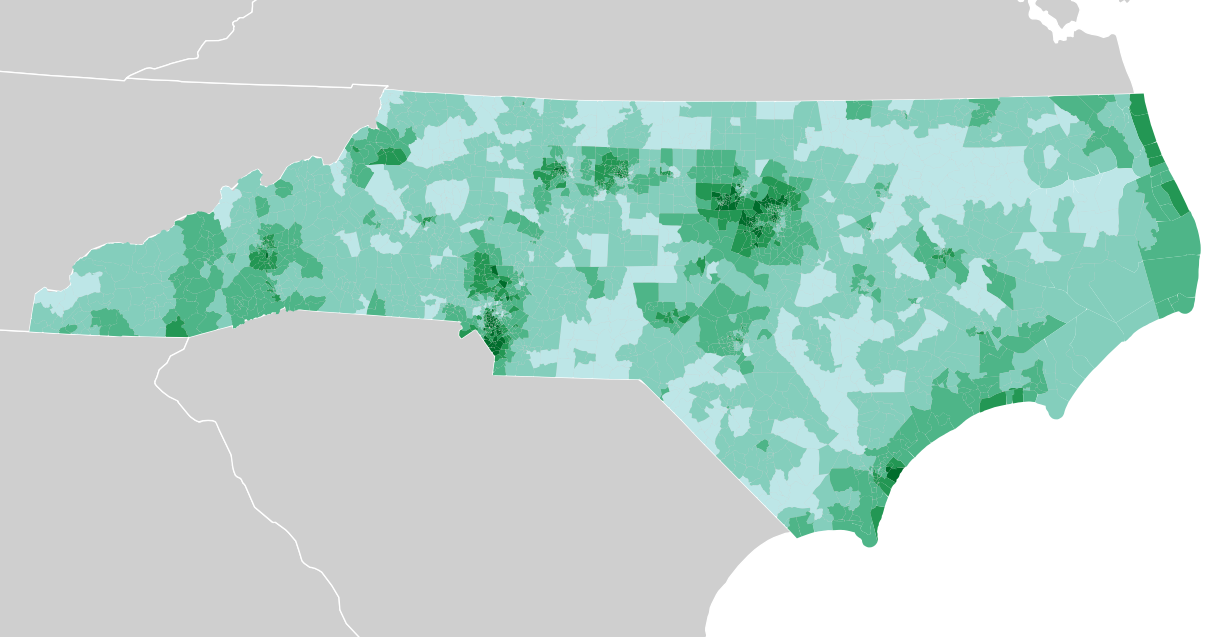
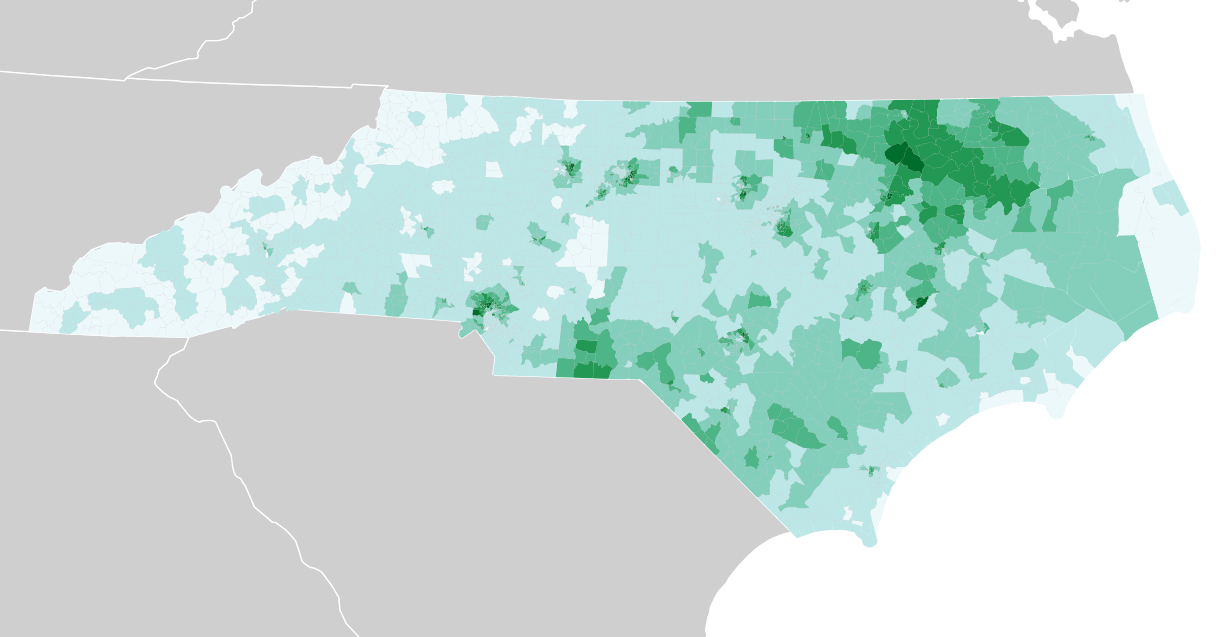
Median income:
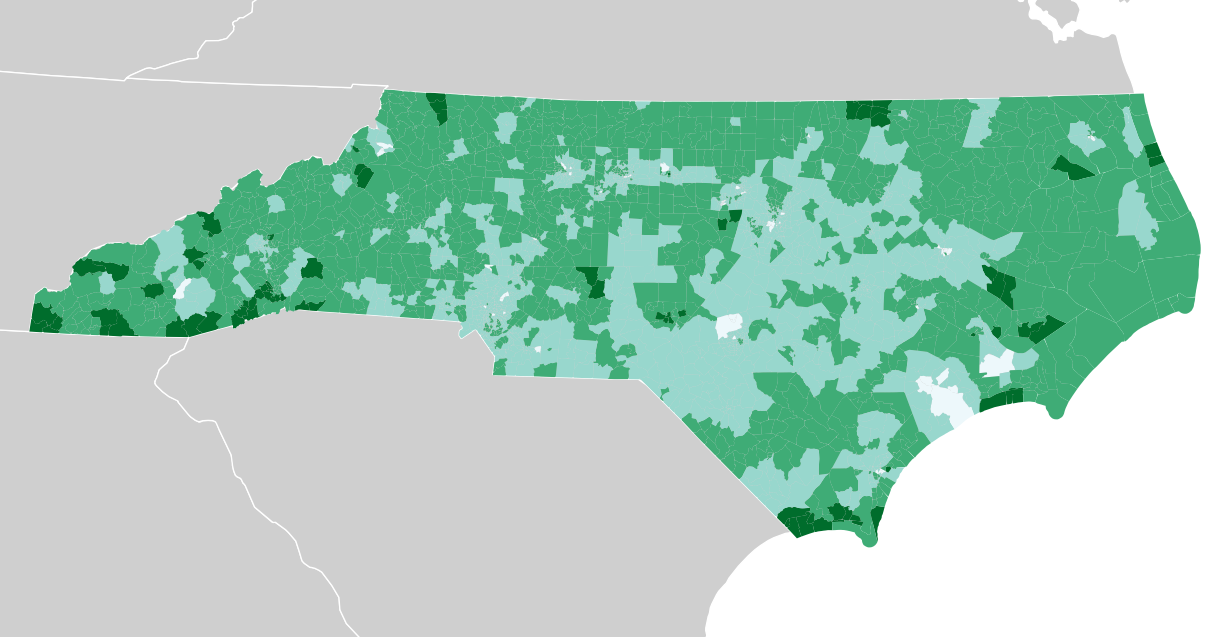
Other variables like the African American population or median age show other patterns, such as the dense concentration of black voters in the rural northeast:
Median age:
What’s possible with this data?
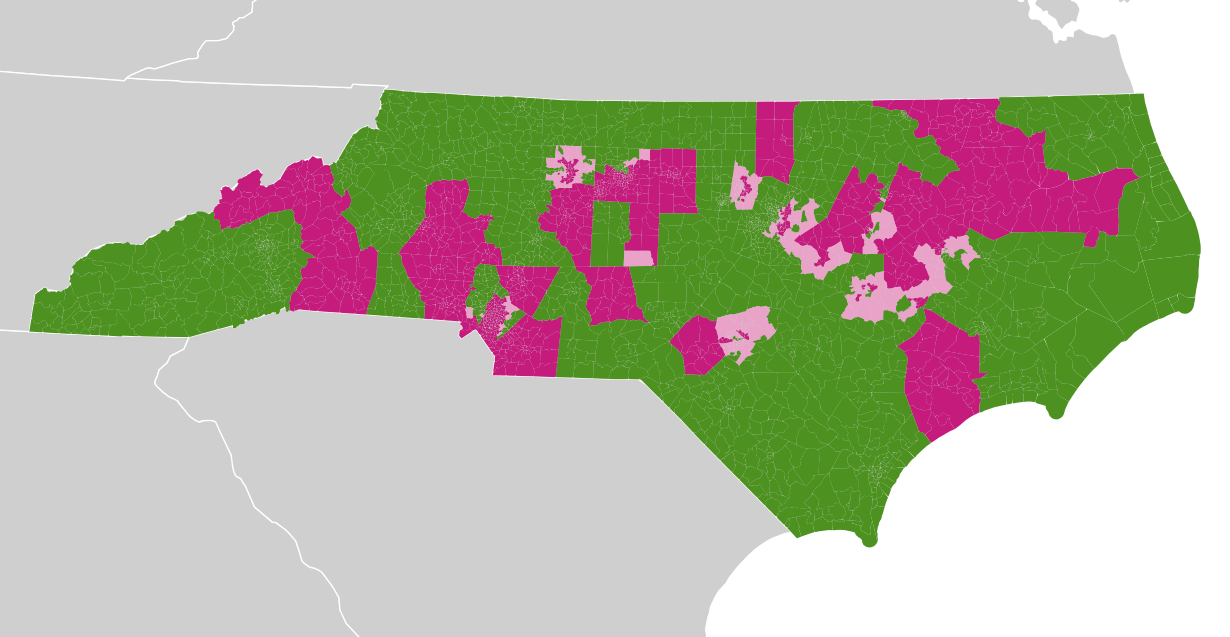
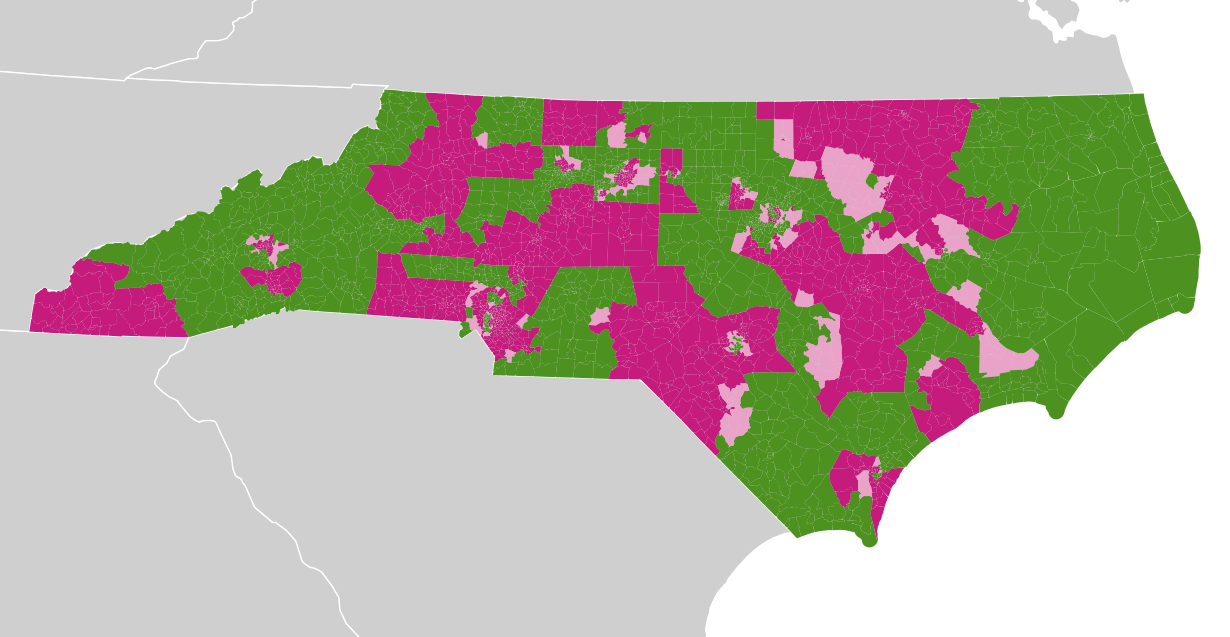
In columns labeled “contested”, I marked precincts with single-candidate races. There are many of these, visible in these two maps of State Senate and State House precincts with green showing contested races, purple showing uncontested races, and lighter pink showing a mix where more than one kind of race was tallied in a given precinct. Every one of these purple areas will need to have its vote totals estimated from other statistics:
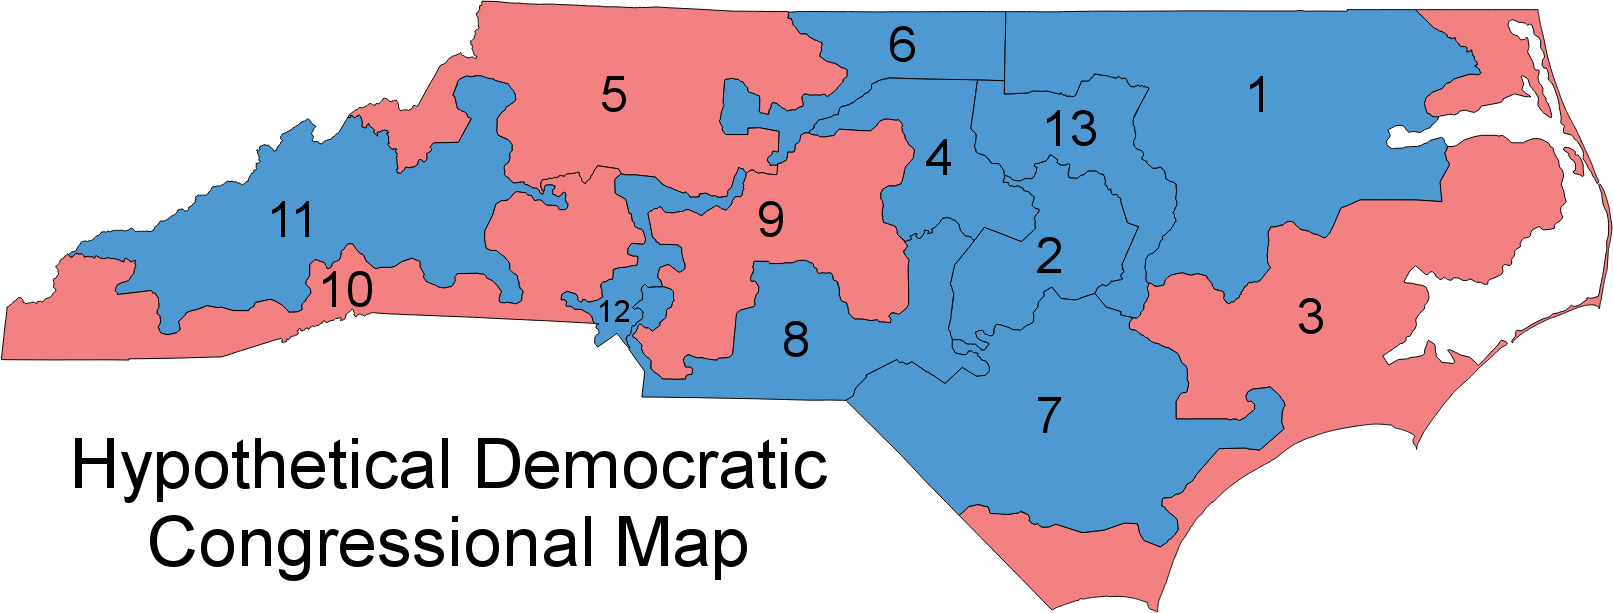
With vote counts predicted for the purple precincts using demographic and other data for the green precincts, it should be possible to create new maps like this from Stephen Wolf, with accurate predictions of partisan outcomes for new plans:
There are some easy next steps with this data.
For example, Nelson Minar recommends running the green precincts through an algorithm like Principal Component Analysis (PCA). The value of PCA, as Nelson and my friend Charlie Loyd suggest, is that it can quickly point out which input variables strongly explain variation as a hint about what’s important when trying to impute new values. For example, is age important, or income?
Heavier machine-learning approaches such as neural networks might do a good job finding hidden patterns in the data, and coming up with good predictions based on all available input data. ML has a negative reputation for reinforcing bias and offering opaque results, but the point here would be to guess at plausble vote counts in the purple precincts. Tensorflow and Scikit-Learn would be the tools to try here.
Growing New Data
If you want to help with geodata, browse the issues in the repo to find data that needs collecting.
Meanwhile, the annual NICAR conference for digital journalism brought a renewed call for participation from the Open Elections project. Project cofounder Derek Willis particularly calls out these areas in need of data entry:
North Carolina and Virginia are two important states with electronic data on the way, and volunteers are working on Wisconsin. Try some of the links above to find data entry tasks for Open Elections.
Thanks to Nathaniel, Nelson, Ruth, and Dan for reading an early version of this post and providing helpful feedback.
subscribe to ![]() this site.
|
contact Michal Migurski
this site.
|
contact Michal Migurski
Comments
Sorry, no new comments on old posts.