tecznotes
Michal Migurski's notebook, listening post, and soapbox. Subscribe to ![]() this blog.
Check out the rest of my site as well.
this blog.
Check out the rest of my site as well.
Oct 9, 2009 4:12am
read-write mapping
NACIS, the North American Cartographic Information Society, was kind enough to invite me to deliver the keynote for their annual conference yesterday.
What. A. Thrill.
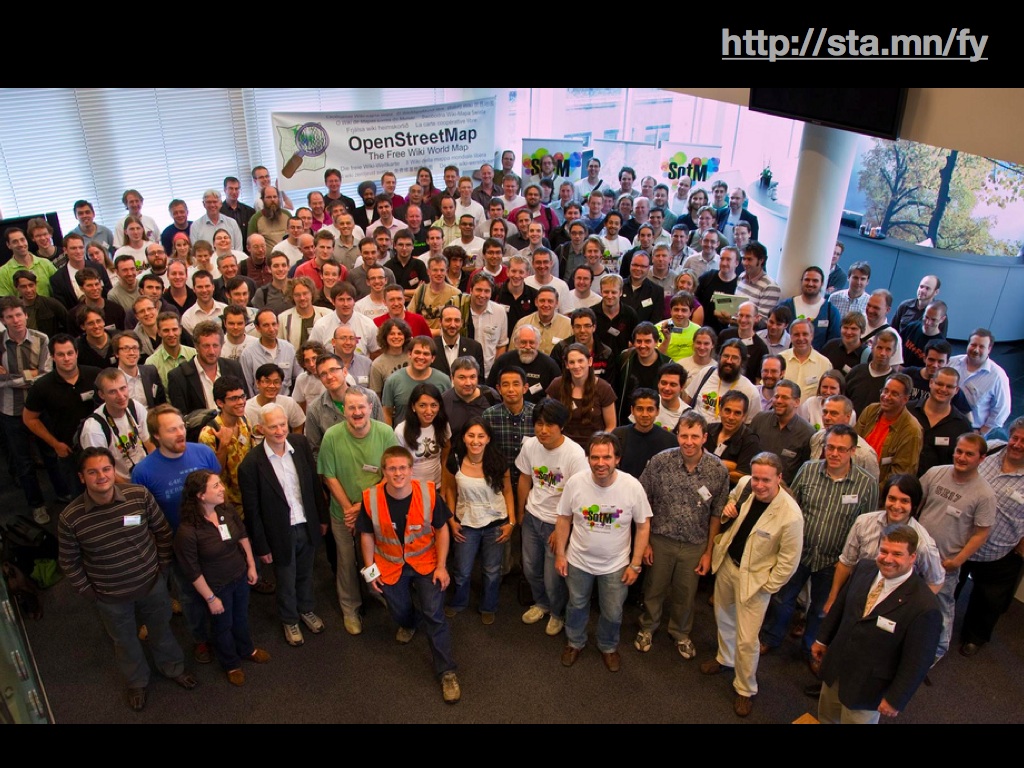
I used the opportunity to talk about the fascinating OpenStreetMap project, specifically the ways in which it's useful to a cartography audience and how that audience could benefit the project. This last thing in particular is what I closed with: I think the online face of OSM's rendered tiles could use serious input from the NACIS community, particularly at the kinds of medium scales where the highly-detailed data blurs into "features". Much of this happens by-hand in tools like Adobe Illustrator from what I can tell, a very different workflow from the industrial automation offered by my favorite stand-by, Mapnik.
It was an excellent group, as enthused about maps as I am, composed of working cartographers and map librarians. It was a chance to meet some folks that I've been following online for ages and dork out about maps for two days. The conference is still going, sadly I had to return to the mission for friday work.
One thing I experimented with a bit in this talk was the use of on-screen shortened URL's, which I hoped might make it easier for audience members to note anything of interest while the slides rolled by. Also, although I wrote and printed everything below, the talk itself was a bit more loosely structured, since I'm terrible at paying attention to people and paper at the same time.
Anyway.
This is a talk about a new awareness of maps and geography, and a change in attitudes toward maps.

I'm going start with a small detour here to tell you about an online phenomenon that's going on four or so years now, called Unboxing. Unboxing is a kind of geek striptease, described in one site's tagline as a "vicarious thrill from opening new gear".
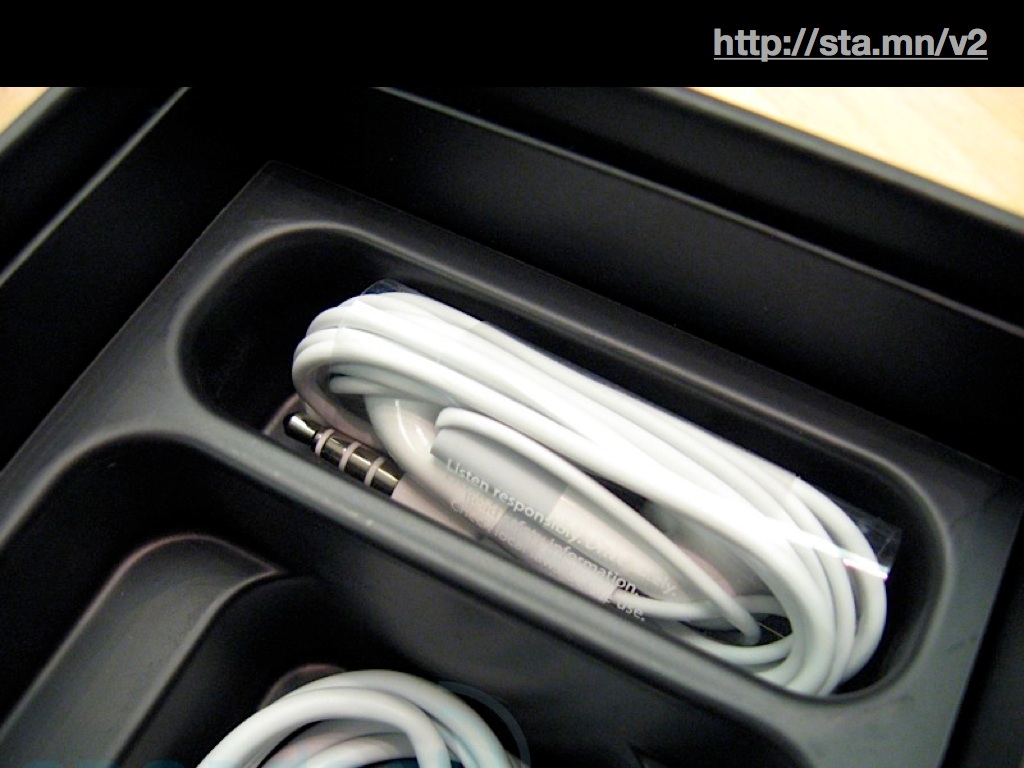
Unboxing is a response to the meticulous packaging of modern electronics gear, most notably Apple's range of iPods, iPhones, and Mac computers - careful design is invested in the packaging, and careful appreciation is invested in its removal.
Why unboxing? Two aspects of the trend seem relevant here.
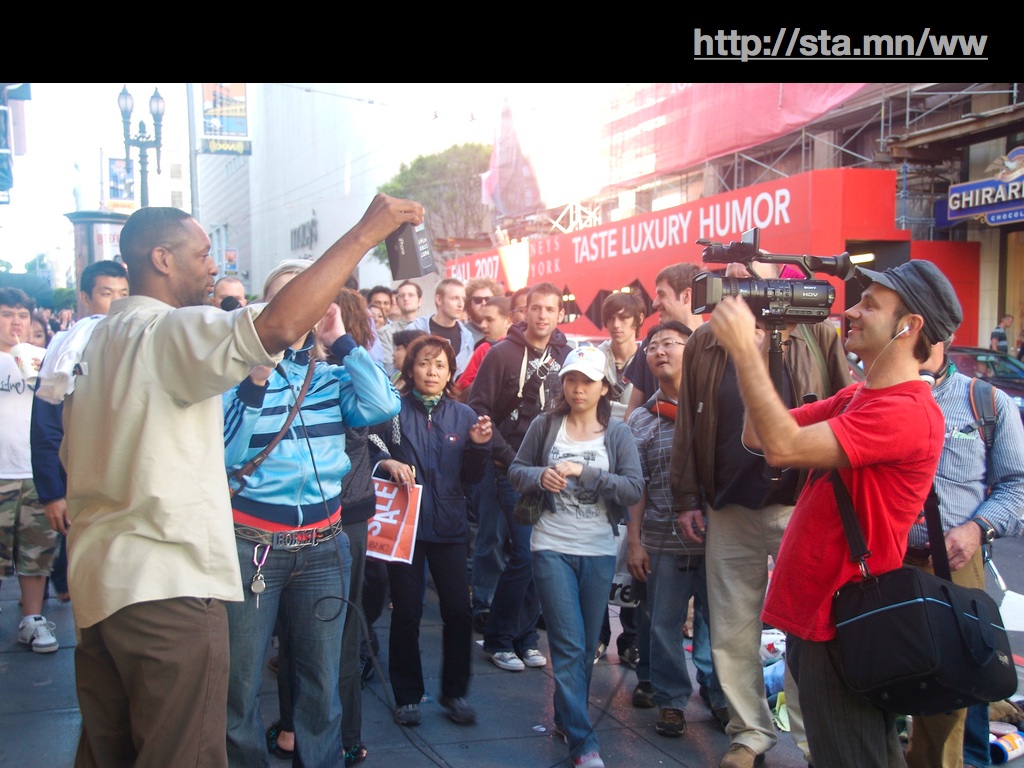
First, it's a new kind of visibility into the fan club culture around popular electronics, allowing users to elevate their own appreciation of a mass-market good into a social experience. I remember bicycling past the Apple Store and the Cingular store on San Francisco's Market St. on the day the iPhone was released. There were enormous lines in front of each, and as customers picked up their new iPhones they'd walk out the door, break into a jog, and high-five the remainder of the line. The division between fan and star here evaporates.
Second, the delivery mechanism for this fan-produced culture tends to be online sharing sites like Flickr and YouTube. Both are examples of the phenomenon of the "Read Write Web", the now-familiar pattern of web-based communities formed around the creation and sharing of social objects like photos and videos.

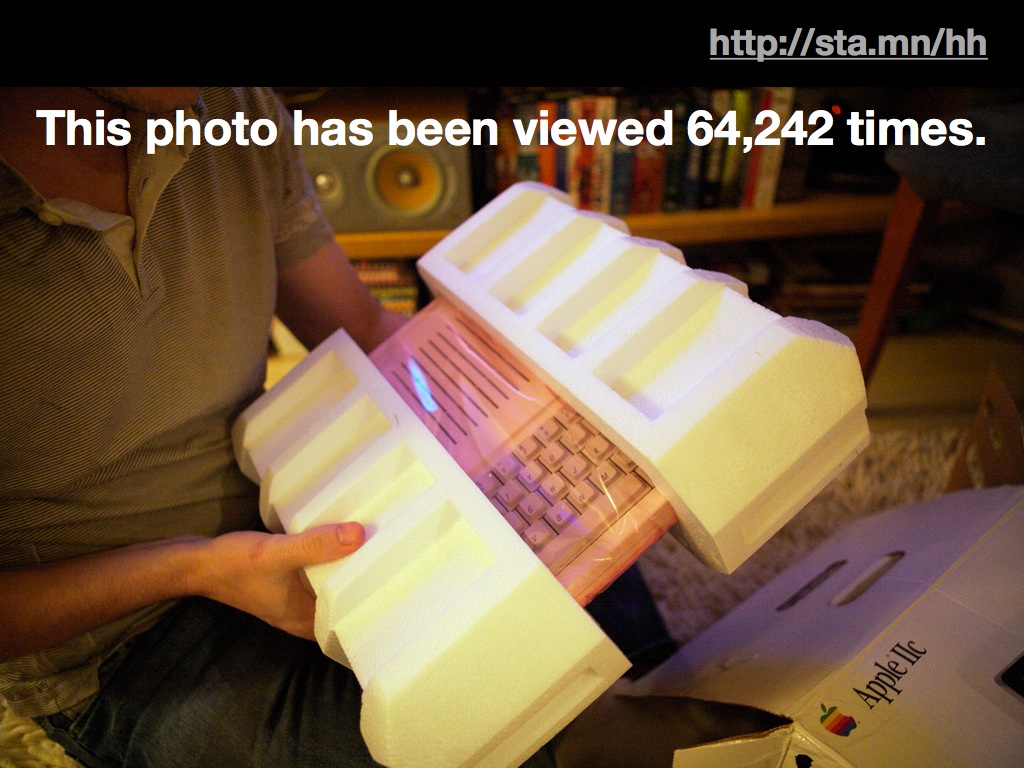
One effect of these online communities is a new and durable awareness of the process behind creative production. Pages on Flickr or YouTube follow a pattern you're probably familiar with: title in the upper-left, main "thing" just below that, and to the right at the same level of importance, the person who made it for you. Responsibility and provenance along with all the messiness and point-of-view are built-in assumptions.
In the world of text, we see this same pattern on Wikipedia.
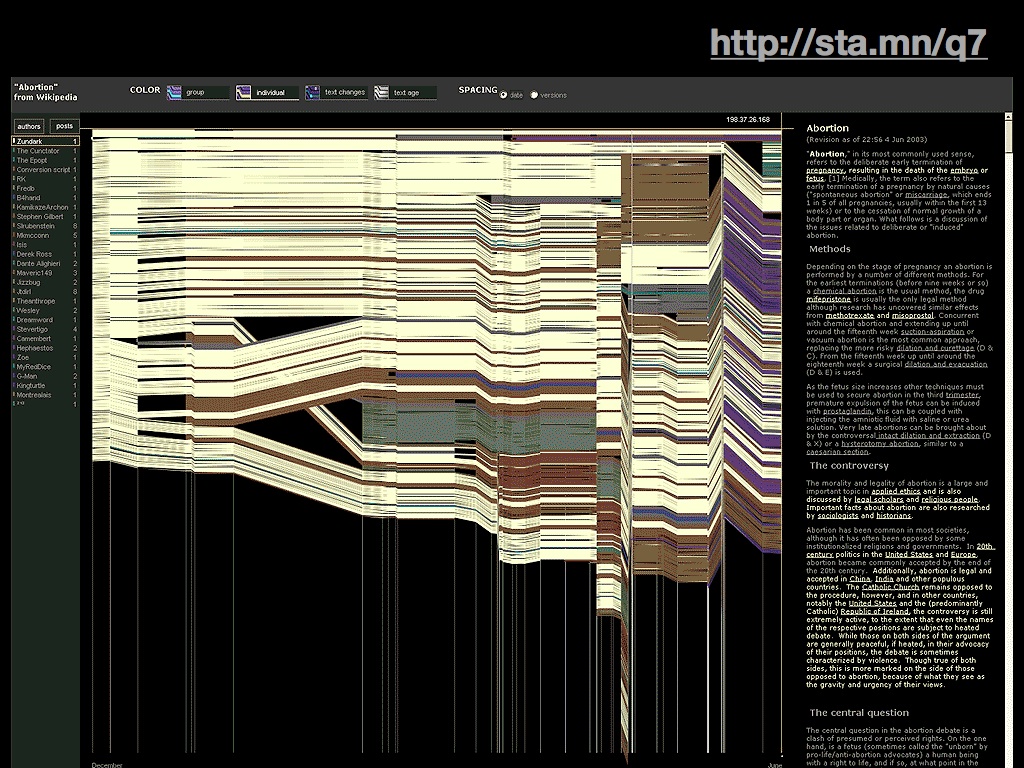
This is the History Flow project from Martin Wattenberg and Fernanda Viegas at IBM, which shows edits to a single Wikipedia article over time as threads and contributions from a group of editors.
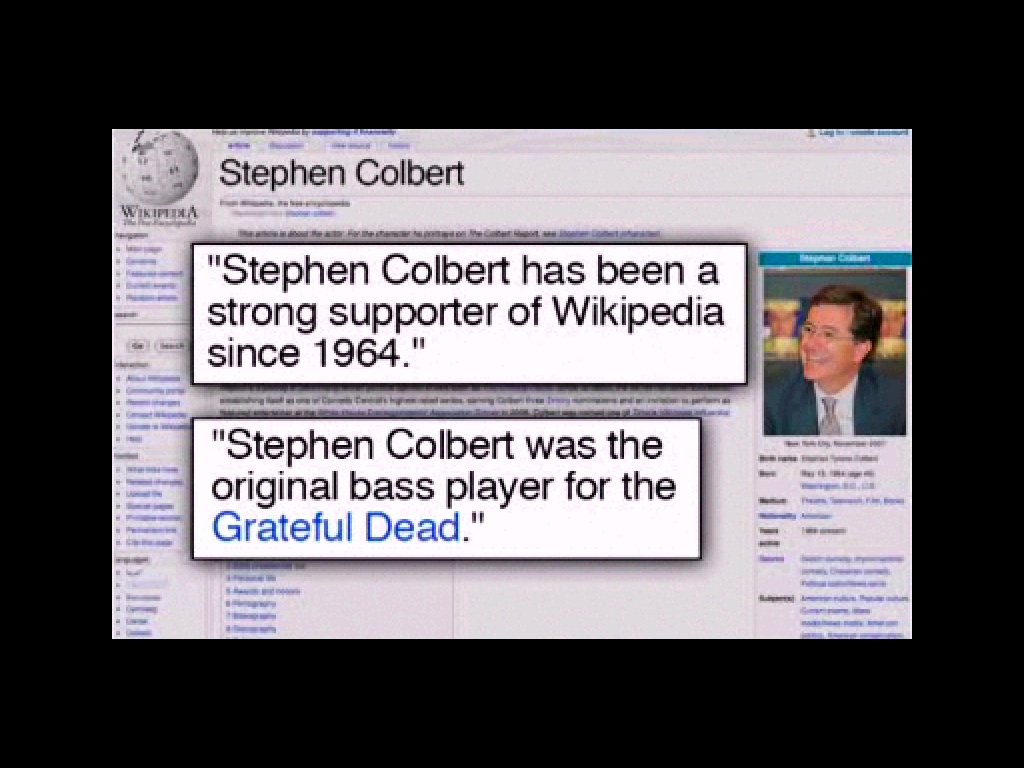
Like this one, each article has been beaten into shape over time by a group of people following loose rules of cooperation, so each page has an associated "Talk" page where you can peek into the arguments and negotiations connected to the particular set of facts represented there. You can see the sausage being made. You can also cause the sausage to be made, as we saw with Stephen Colbert's parody of consensual reality he called "wikiality" and used to make occasional, abusive, hilarious forays into Wikipedia.
This is where we segue into geography.
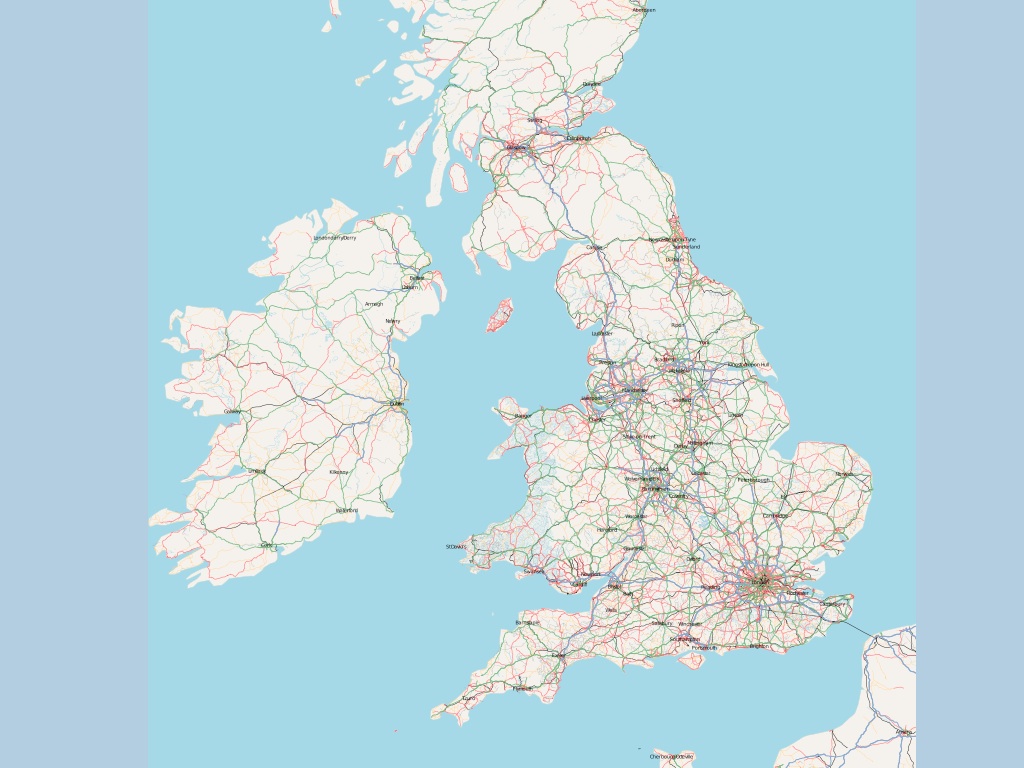
Around 2004 or so, UK developer Steve Coast started a project called OpenStreetMap, the Wiki world map. Steve was connecting a few emerging threads: the falling cost of GPS hardware since it was made available for civilian use in 1996, the dismal copyright layer wrapped around Ordnance Survey maps, and the lack of a viable crappy-but-free alternative in the UK. It's hard to overstate how crazy this idea was at the time; everyone knows that collecting worldwide geographic data at the street level is a massive undertaking, out of reach of an enthusiast community like the OSM of the time.
What was the state of online mapping at the time? Not terrible, but not great.

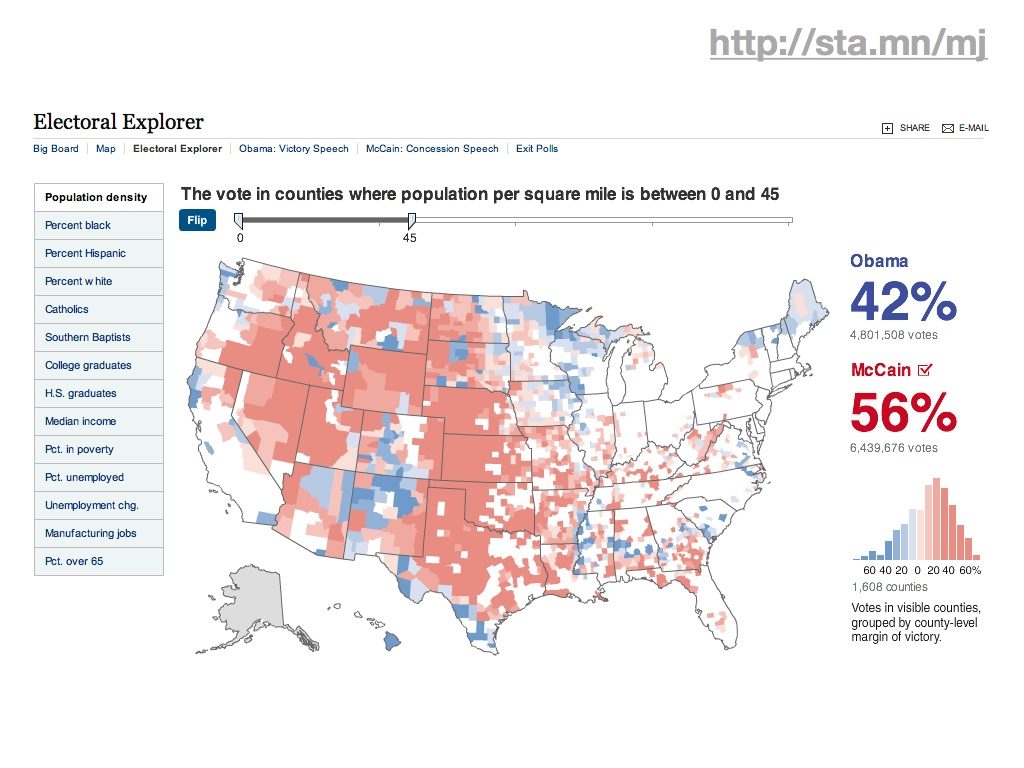
The National Atlas, among other sites, makes administrative boundary data freely available. It makes possible projects like these election maps from the New York Times, which surface county boundaries and election results in a dynamic, interactive context.

Using data like this, we made an early Stamen project, Mappr. Mappr was an early attempt at applying geography to images on Flickr, and the only information we had to go on in 2004 was a loose match on town and state names. I didn't know a thing about shapefiles and only a bit about projections, so I started with a bitmap of the lower 48 and created this simple Flash-based map of the United States. It lacked any details other than borders, but this paltry context was enough to clearly communicate the loose geographic placement of Flickr photos on the basis of tags.

We took that same codebase and applied it to the MoveOn Virtual Town Hall in summer of 2004, where it was possible to see yourself and 50,000 other live participants in an interactive geographic setting. Again it lacked towns or roads, but the presence of the people themselves was enough to place the whole event in context.
Early the following year, Google released their Maps product, which introduced pervasive, available, beautiful road cartography in an interactive package we had never seen before. We think of this as a sort of Year Zero in online mapping.
Two things resulted from this release: every website that could possibly justify the inclusion of a map started using Google's, and normal web users' expectations around online cartography reanchored themselves to Google's design decisions around tiled delivery, road display, and coloring. We moved from the primitive aerial imagery of TerraServer, to a much more advanced kind of cartography. We also brought on the specter of what Schuyler Erle calls "red dot fever" - the profusion of pin maps with the context obscured by the data in front.
Mappr and MoveOn both immediately scrolled into the past to be replaced by the iridescent oranges and greens of Google Maps. I think there's something a bit unfortunate about this switch, but then again we're currently in the middle of a new transition where over half of all online map usage is taking place specifically on the iPhone, where the desktop visual design of Google Maps may or may not prove to be appropriate in the long term.
So it's 2009, and OpenStreetMap has attained a level of completeness long believed impossible through a slow, stubborn process of piecemeal growth punctuated by massive donations of raw data. The project is run along many of the same lines as Wikipedia: you can see who's added what data, choice of what's worthy of inclusion is left to the volunteer community, and the end result is covered by a license that emphasizes freedom over all else: Creative Commons for OSM, GNU Free Documentation License for Wikipedia. The social model around this kind of co-creation has been described by programmer Brian Marick as "artisinal retro-futurism and team-scale anarcho-syndicalism".

Why has the project been so successful? It is rooted in the Four Essential Freedoms of open source software identified by Richard Stallman: the freedom to use, study, share, and change. Stallman numbers them starting from zero because he is a programmer. It's worth noting here that the bugaboo of the so-called viral license is mostly a paper tiger. Share-alike licenses like those used by OSM and Wikipedia grant you new rights you wouldn't otherwise have, and ask for their continuation as a form of payment - as these licenses become the norm rather than the exception, they will cease to be controversial.
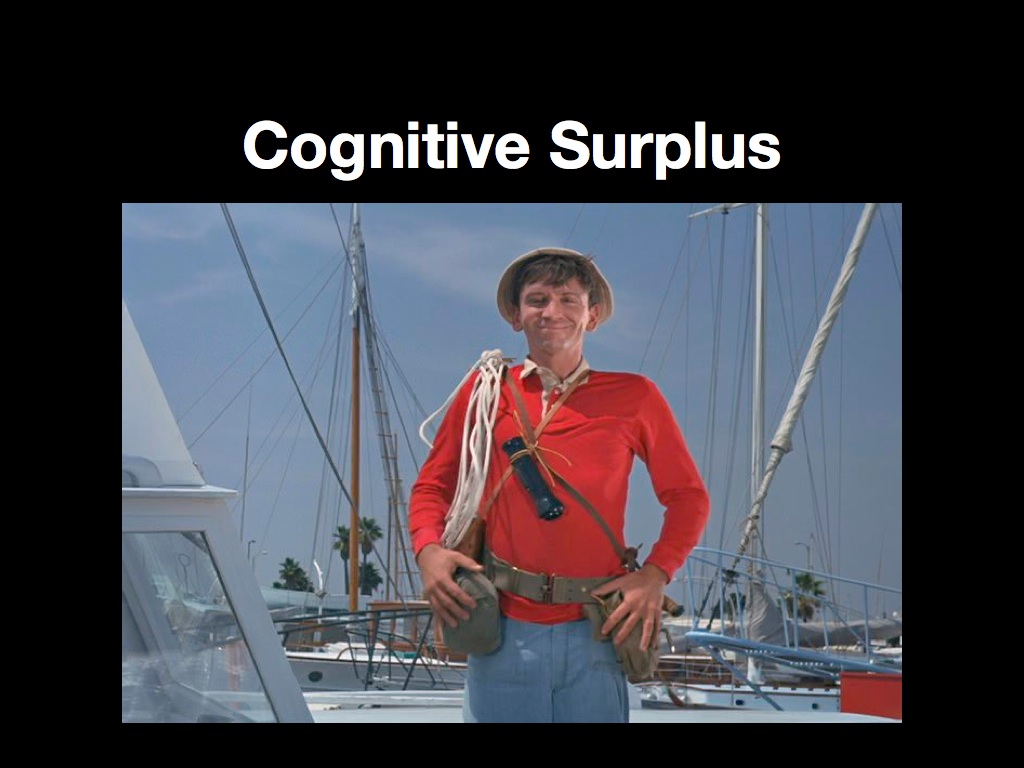
Currently, they're a pre-requisite and necessary motivator for taking advantage of what Clay Shirky has called a "cognitive surplus".
OpenStreetMap is also a generative system, welcoming unanticipated innovation.
Jonathan Zittrain identified five characteristics of generative systems that are relevant to OpenStreetMap: "(1) how extensively a system or technology leverages a set of possible tasks; (2) how well it can be adapted to a range of tasks; (3) how easily new contributors can master it; (4) how accessible it is to those ready and able to build on it; and (5) how transferable any changes are to others—including (and perhaps especially) nonexperts."
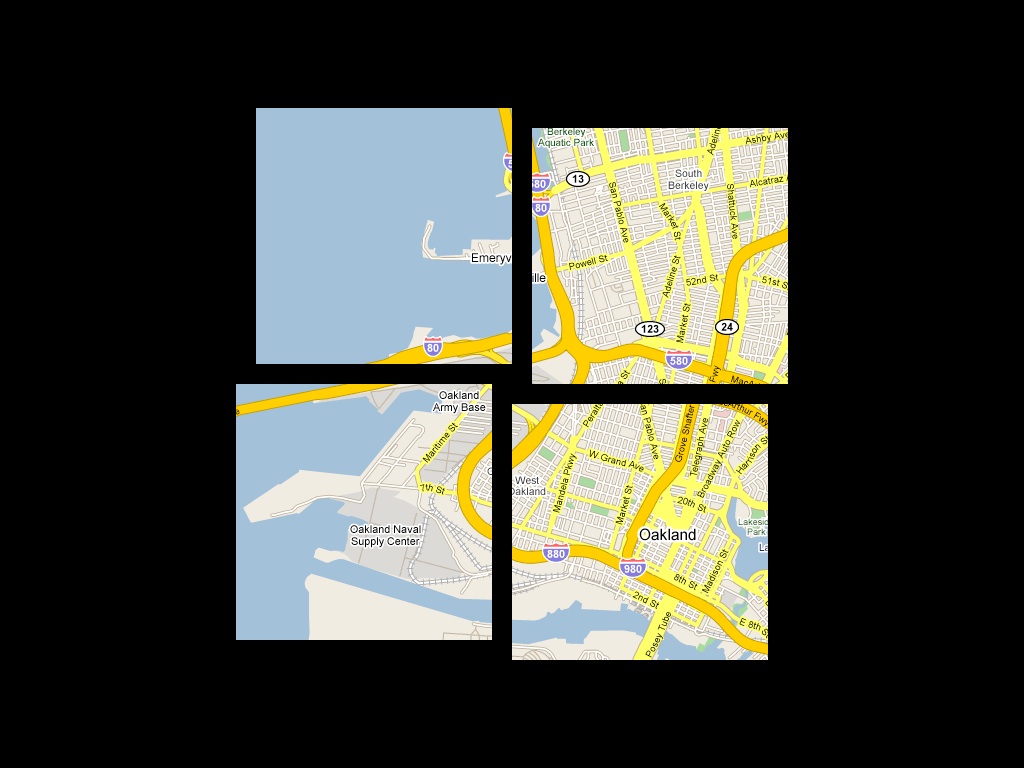
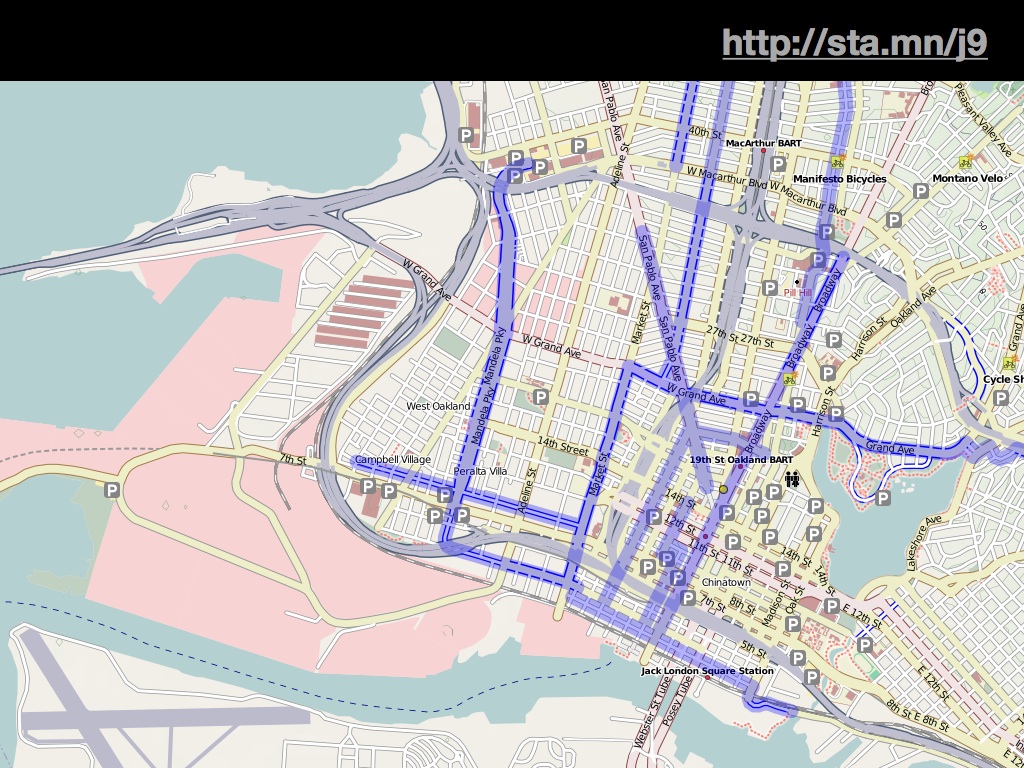
A few of these are directly applicable to this audience. The data in OSM is can be directly used to create beautiful city-scale maps for many metropolitan areas, today. Here are a few projects that we and others have created using OpenStreetMap data as a base.
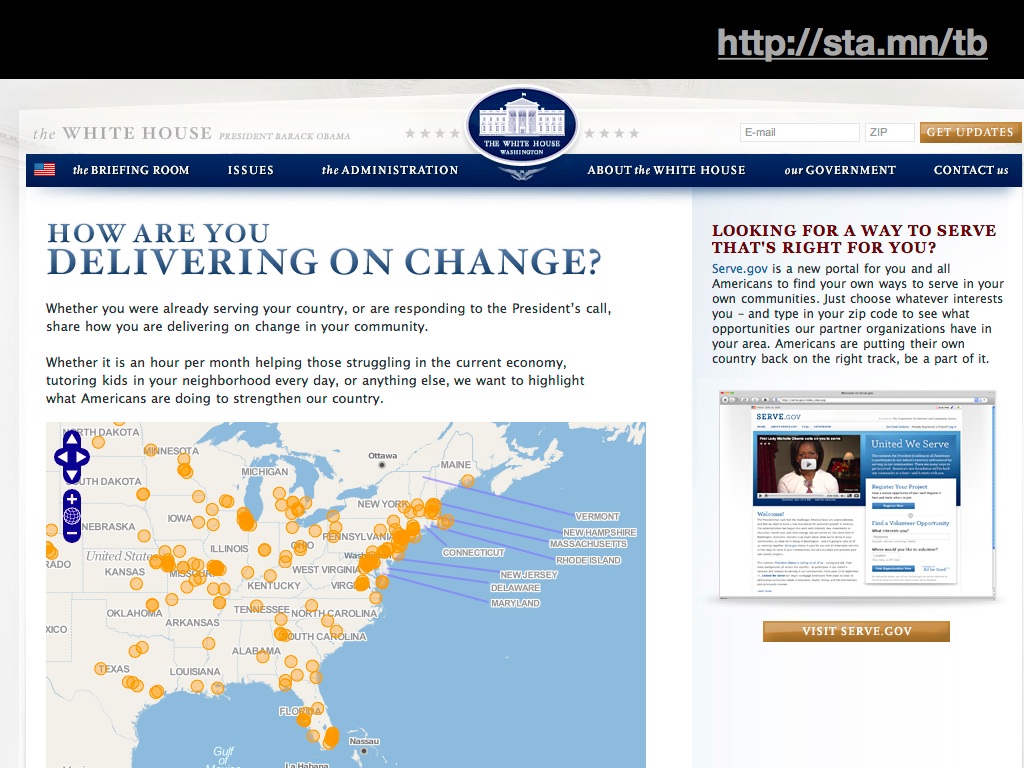
White House: how much more legitimate can things get?
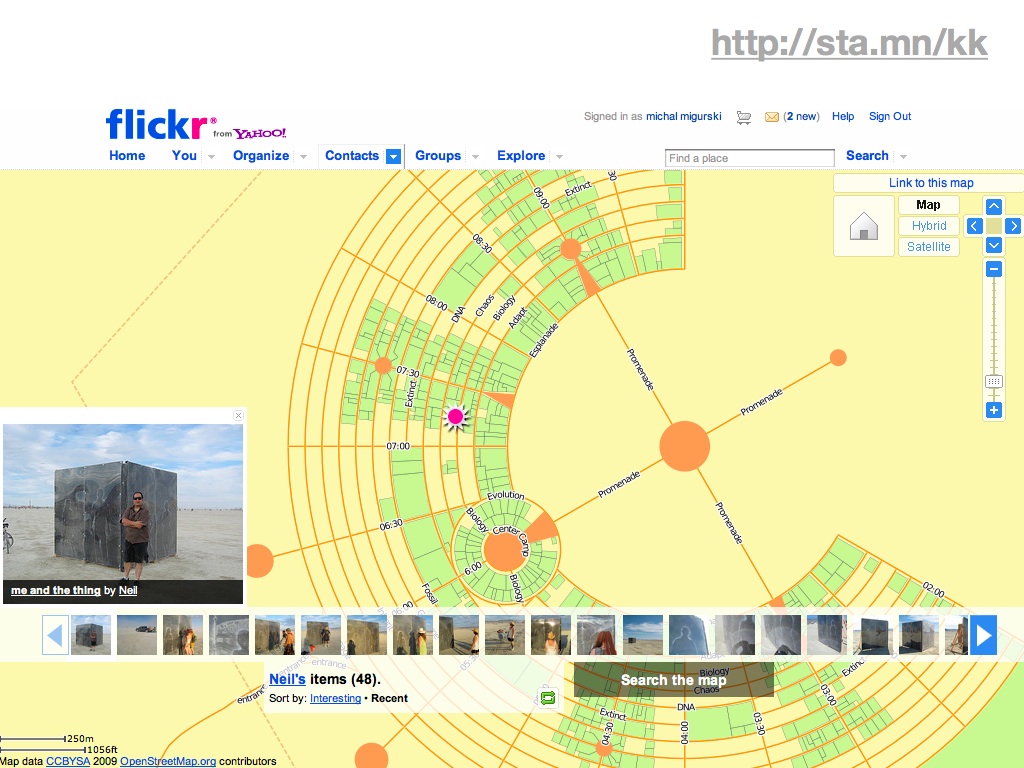
Flickr world cities: providing context in moving places like Black Rock City and underserved places like Tehran.
Cloudmade Style Editor, Stamen styles, Lynchian_mid: placing the tools to perform basic worldwide cartography edits in the hands of web people.
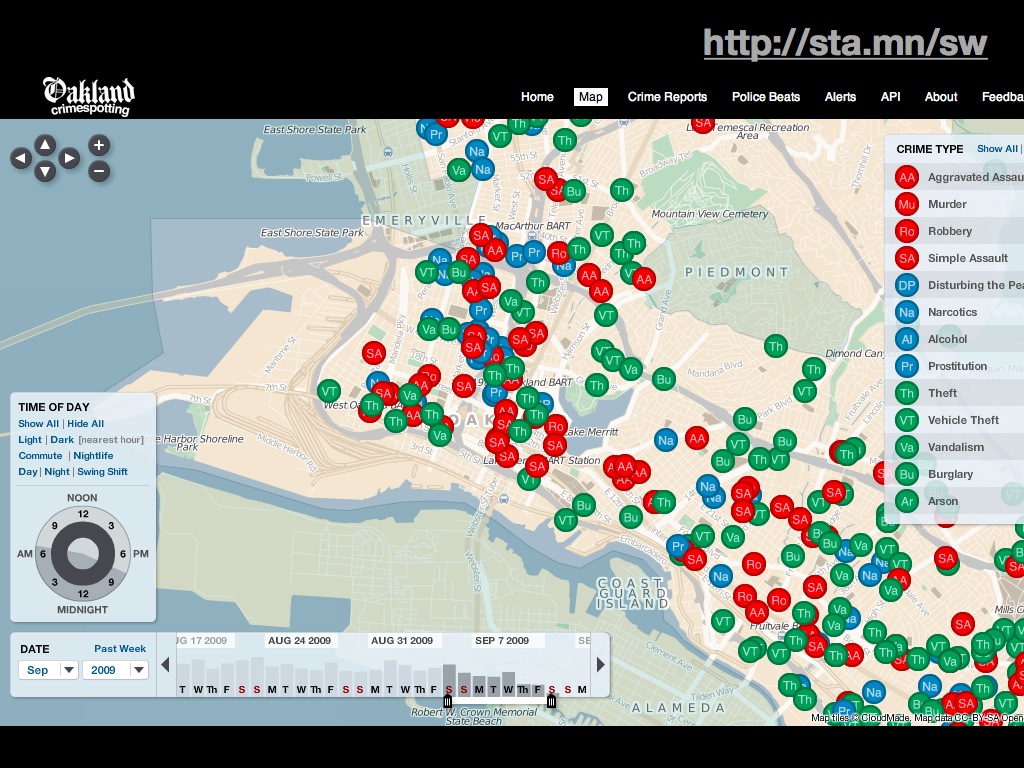
Oakland & SF Crimespotting: Pale Dawn was in some ways designed specifically with Crimespotting in mind, and SF accepted OSM's use in its "app store" uncritically.
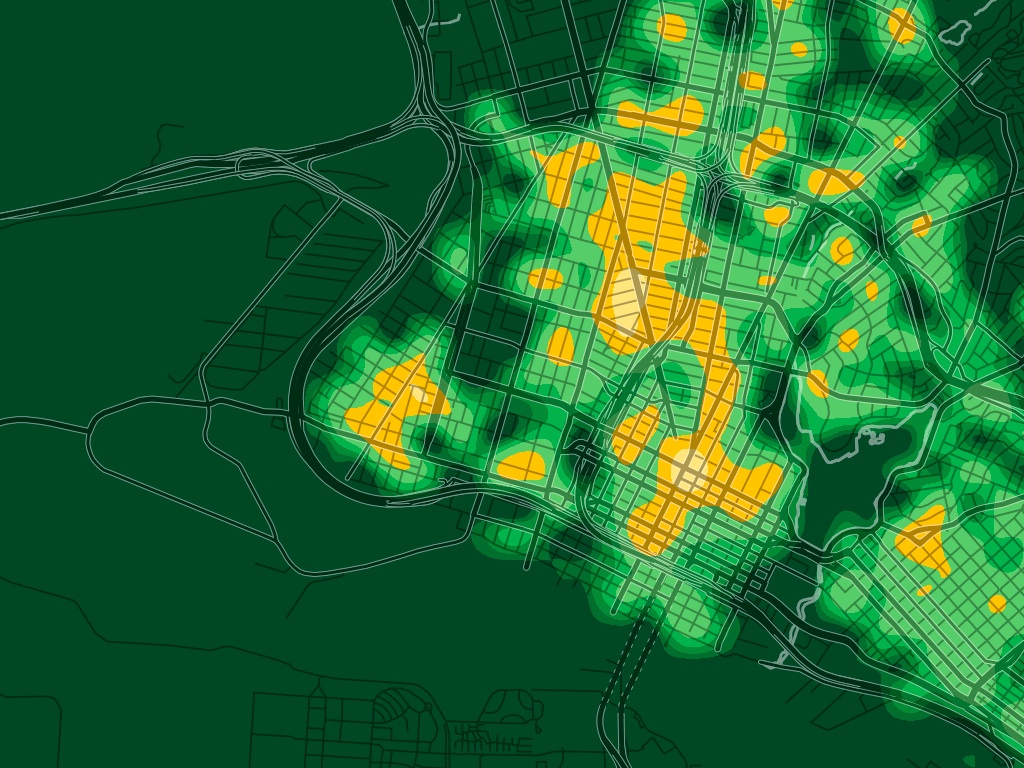
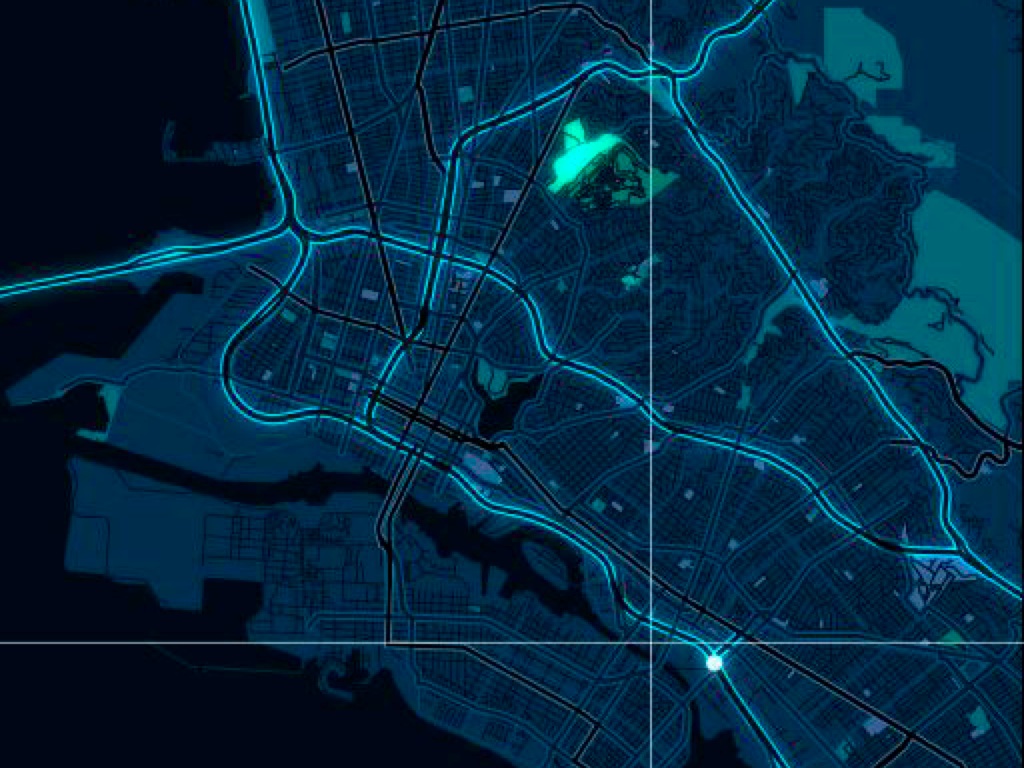
Crime heat maps show how the data can be presented in new ways in you have the vector data to work with.
The data in OSM is large with great coverage, and it's also available for you to change.
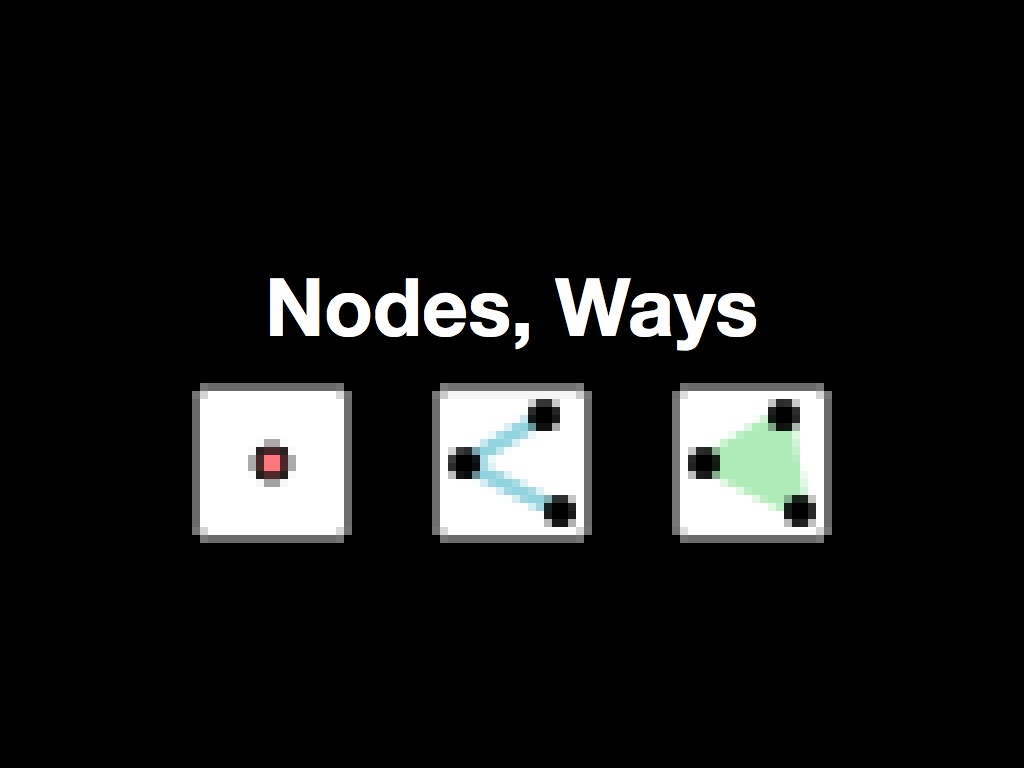
The model is incredibly simple. There are nodes: simple points with a and latitude, longitude. There are ways: lines made out of nodes, one after another, sometimes closing a loop to form an area. Finally, there are tags, where the real negotiation takes places. OSM's official stance on tags is that "you can use any tags you like as long as the values are verifiable. However, there is a benefit in agreeing to a recommended set of features and corresponding tags." This is an opportunity big enough to drive a truck through: commonly-used tags for road types share space with rare and esoteric tags often limited to specific individuals or groups. The tags are what make OSM generative.
Here are a few projects that use OSM's tag structure to create something new.
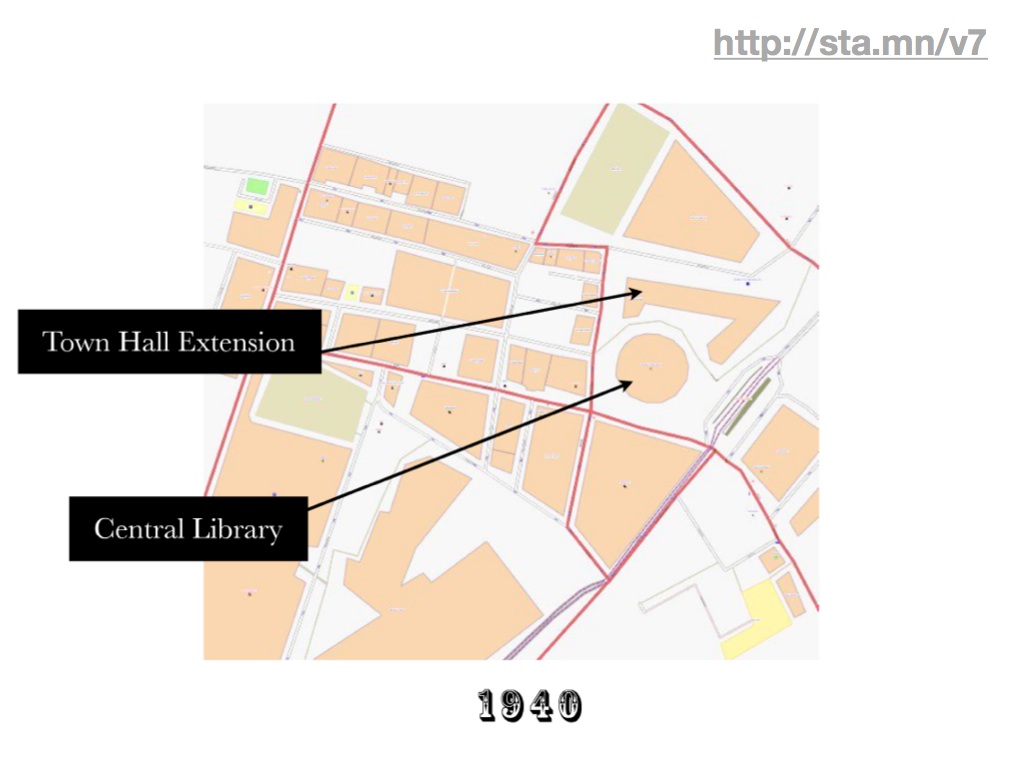
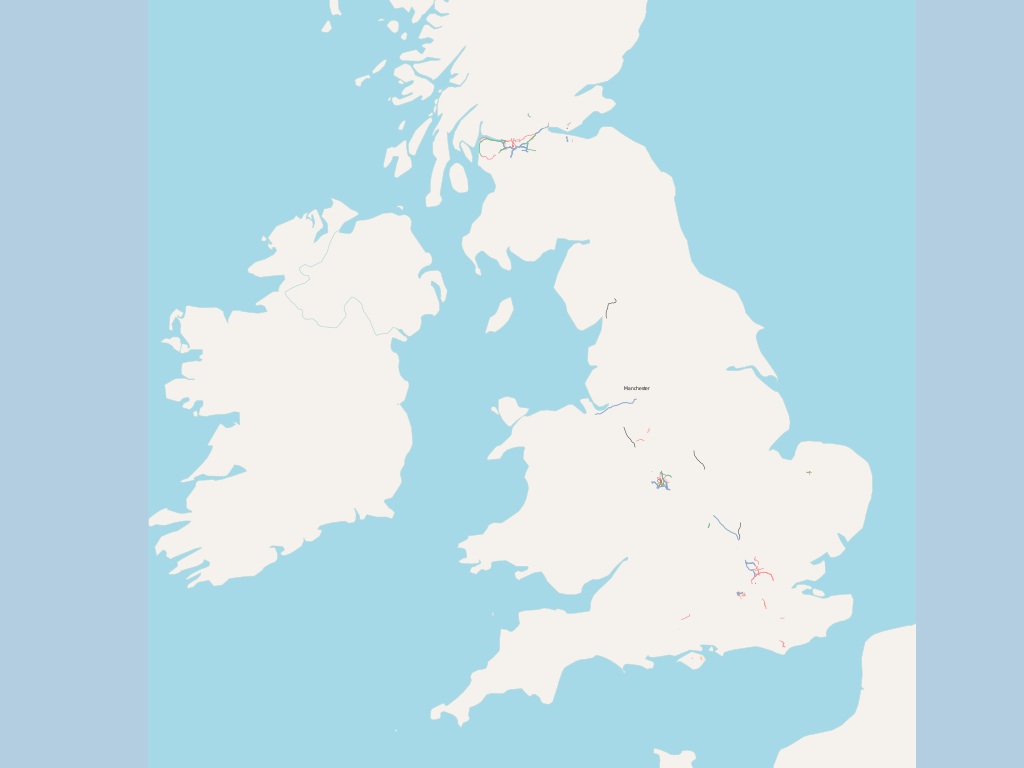
Frankie Roberto's historical date tags offer the promise of temporal coverage by including "start_date" and "end_date" tags on buildings in his native Manchester.
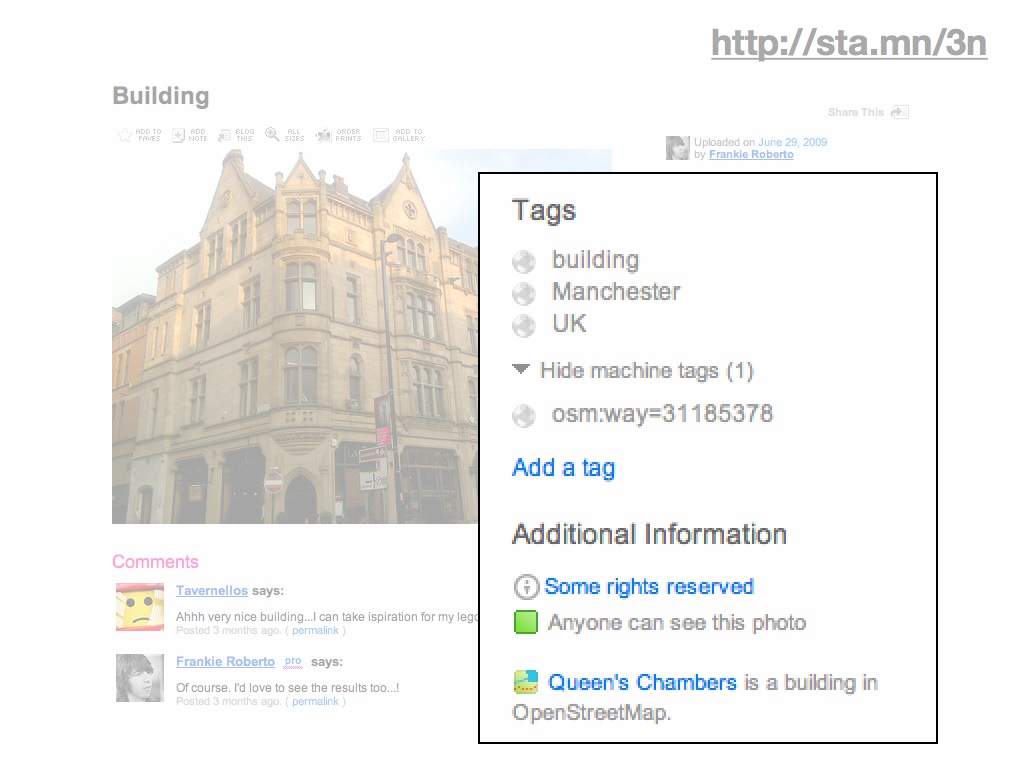
Flickr's new found machine tag support for OSM ways is gracing items like Frankie's photograph of this historical site.
Andy Allan's OpenCycleMap won an honest-to-goodness cartography award, for being one of the first major designed projects connected to OpenStreetMap.
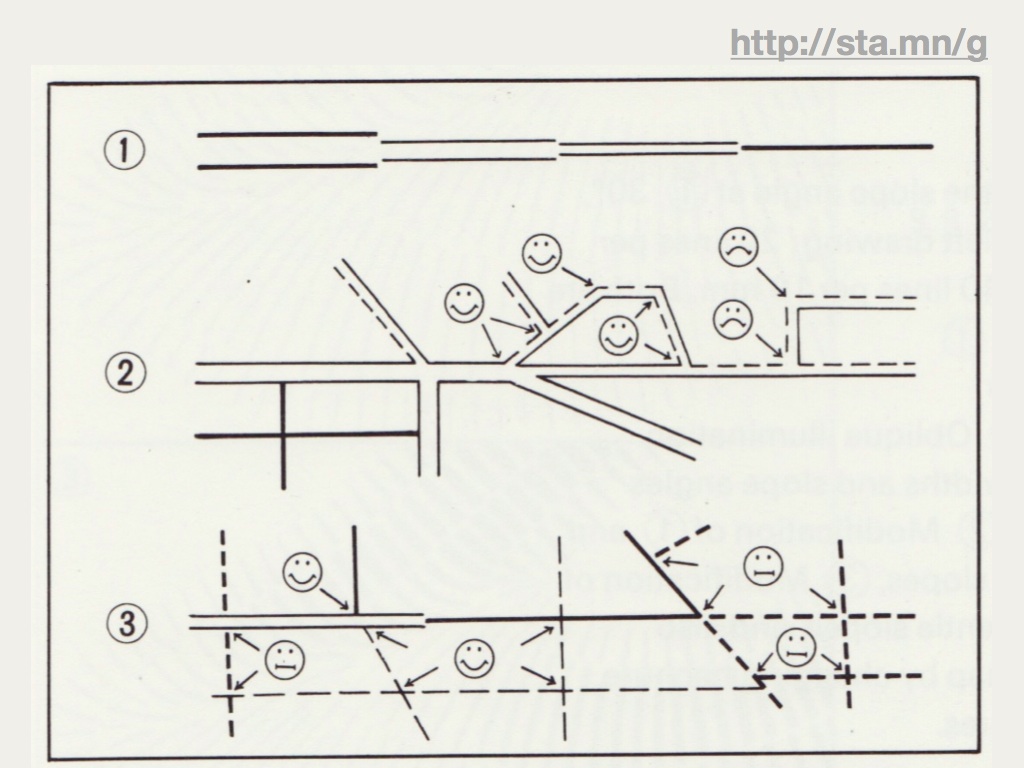
The model is also incredibly primitive, from the point of view of good cartography. This is where everyone in this room comes into play. We know from the data-gathering methods used by OSM - GPS, Walking Papers, neighborhood parties - that the primary focus of the project is on the city and street scale, where details like post boxes and bicycle lanes make a difference. We also know, thanks to the efforts of the USGS and Natural Earth, that small scale map data is available for unrestricted use. What's missing from this picture is a hole in the middle: a space between the 1:10,000,000 and 1:250,000 or so scales where motorways, parks, towns, and administrative boundaries are important, but currently stored at an excessive level of detail in a project like OSM.
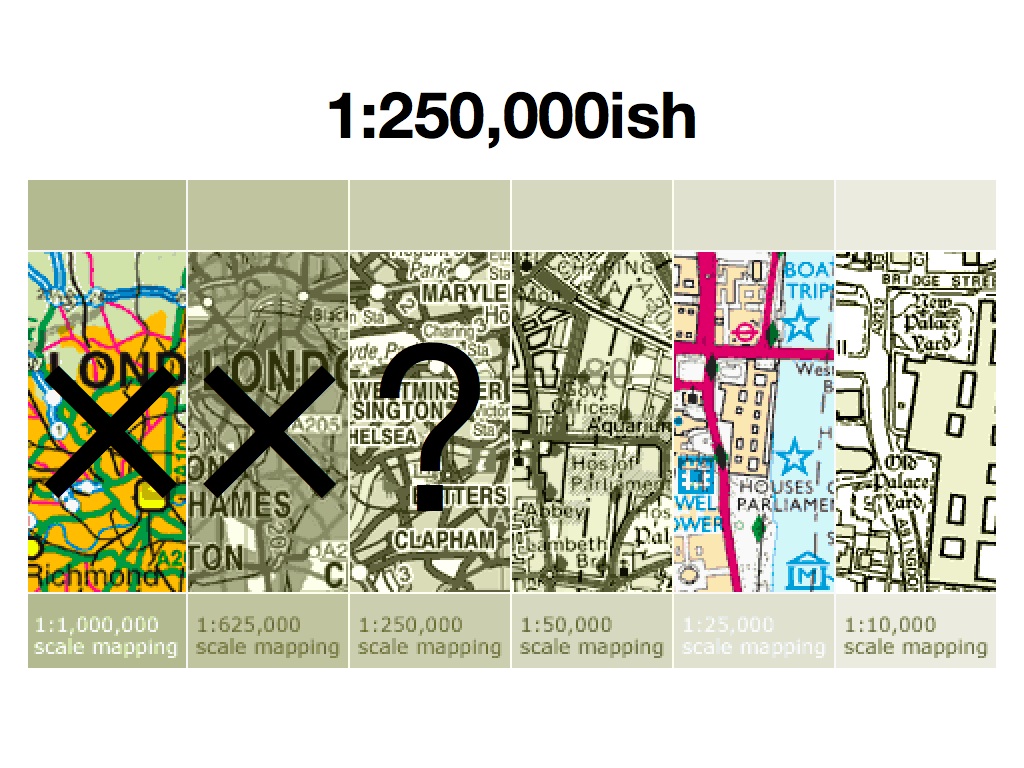
According to Oakland's Lohnes Wright, a feature like a river becomes "something different" when its best representation transforms from the precise riverbanks of OSM to the more general line of a statewide map. How might it be possible to bridge this gap in today's open data world?
More generally, how can thoughtful, correct cartography best be applied to today's online maps? Most digital rendering packages that can operate at the worldwide scale are fairly primitive sets of rules and filters, and can't currently handle the kinds of fluid, responsive placement and drawing decisions necessary for really good maps. They're being built largely by engineers interested in solving engineering problems, the same kinds of people who invented HTML and the world wide web as a vehicle for the efficient delivery of physics papers. It took ten years of experimentation and negotiation to transition to today's online design environment that respects the meaning of the written content and its visual presentation equally.
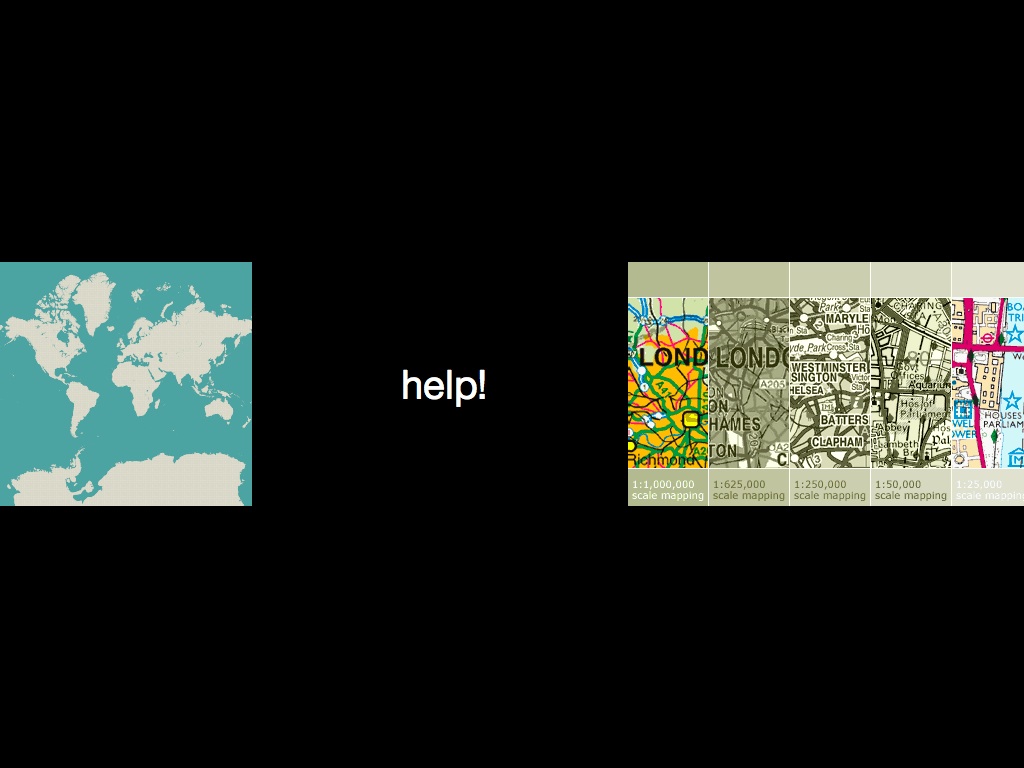
If there are three specific things I'm interested in conveying today, it is that open data is here for you to use, safe for you to use, and in need of your help.

subscribe to ![]() this site.
|
contact Michal Migurski
this site.
|
contact Michal Migurski
Comments (5)
Looks like a great keynote! It's about time to get the cartographers on the ship! Now we just need someone to program a full shape file export filter for the cartographers to be able to use our data! :D
Posted by AxelM on Friday, October 9 2009 5:15pm UTC
Mike, looks like i missed a great talk. I am bummed i wasn't there in person. what great insight. mike
Posted by Mike Byrne on Saturday, October 10 2009 6:14am UTC
was there. absolute fire. thanks mike.
Posted by casey from missoula on Saturday, October 10 2009 7:26am UTC
Thanks guys! Axel, "there are ways" to make shapefiles out of OSM, but it'd be really nice to have it as a native export format.
Posted by Michal Migurski on Saturday, October 10 2009 7:52pm UTC
Great talk, very nice examples!
Posted by Dieterdreist on Thursday, November 26 2009 11:28am UTC
Sorry, no new comments on old posts.