tecznotes
Michal Migurski's notebook, listening post, and soapbox. Subscribe to ![]() this blog.
Check out the rest of my site as well.
this blog.
Check out the rest of my site as well.
Aug 21, 2007 6:53am
oakland crime maps IX: post-launch
Last week, we launched Oakland Crimespotting, capping off eight months of the occasional data sketching I've been recording on this site. I've covered a few speculative topics here that didn't graduate to the public version of the site, and there have been a number of interesting new things that were sure to add.
The initial work on scraping (post I, post II) is still in use. Thankfully, the city hasn't changed CrimeWatch much since December, so our nightly collection runs are still chugging along happily. We do four collections every evening: past four days, and then individual days a week, two weeks, and one month in the past. The overlap is because we've noticed that the Oakland PD amends and modifies crime reports, and the whole map site is frequently down altogether.
Two later pieces (post III, post IV) introduced an idea on time-based display, but ultimately it was effective to just drop in the dots and add live draggy/zoomy controls. This is something we've consistently found with other projects, too: it's so often the case that the "right" design is not the technically complicated one, but the one that gets feedback and interactivity just so.
Finally, I wrote up a few pieces (post VI, post VII) on public data indexing. This is something I continue to find interesting, but at the volume of traffic we're pushing, it's totally unnecessary. Turns out MySQL is kind of awesome at this sort of thing.
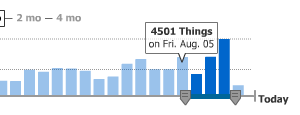
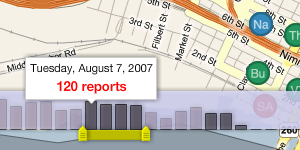
There are two big features on the map interface that only emerged when designing and developing it with Tom and Eric. The date slider is something that we shamelessly nicked from Measure Map, though we added the bit where per-day columns act as a display showing which data has been loaded. This part is still under active development. The idea is that the background should be draggable, to allow people to navigate back further in time than 30 days.
Measure Map:
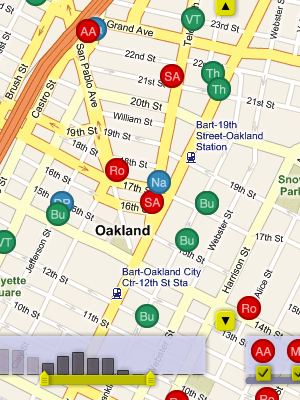
Ours:
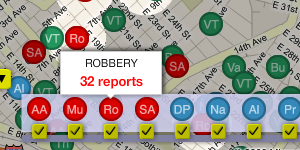
The second is the crime type picker, an interface whose affordances we borrowed from Newsmap. This one's quite simple, but it does trigger the visual spotlight effect that makes it possible to pick out crimes of a certain type throughout the map.
Newsmap:
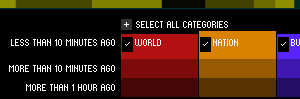
Ours:
It was important that every view of the map be linkable and sharable, so we imported a number of ideas that Tom developed for our last map project, Trulia Hindsight. The thing to watch for is how the URL of the page you're looking at changes as you pan and zoom around. It can be copied, shared in an e-mail, sent over IM to a friend, and posted in a blog.
An "official" API has not been described or announced, but it will most likely include the site's Atom / GeoRSS feeds. These implement a small subset of the OpenSearch request specification:
- bbox is a geographical bounding box in the order west, south, east, north.
- dtstart and dtend are start and end dates, in YYYY-MM-DDTHH:MM:SSZ format.
Look for these hanging off of the /crime-data endpoint.
The site is hosted on Amazon's EC2 service, on a 10 cent/hour virtual server running Debian Linux, MySQL, Apache, and PHP. The static maps are generated by Aaron Cope's recent addition to Modest Maps, ws-compose.py. It's a BaseHTTPServer that stitches tiles into map PNG's, and I've been running four of them (and caching the responses) for the past week with no troubles.
I've rediscovered the joys of procedural PHP4 with this project. EC2 has proven to be a real champ, allowing us to set up a test machine, deploy a living site, but always holding out the possibility of migration to a "real" server. At a total of $80/month, the virtual Debian machine may last for a while.
Next steps may include San Francisco and Berkeley.
subscribe to ![]() this site.
|
contact Michal Migurski
this site.
|
contact Michal Migurski