tecznotes
Michal Migurski's notebook, listening post, and soapbox. Subscribe to ![]() this blog.
Check out the rest of my site as well.
this blog.
Check out the rest of my site as well.
Mar 2, 2007 12:47am
oakland crime maps IV
Last month, I posted a few notes on possible displays of crimes in time. This post shows the small amount of headway I've made towards implementing the competing ideas of spherical vs. conical fields around crime events.
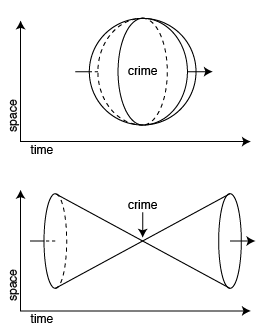
The difference between the two boils down to the shape of the three-dimensional field (two dimensions of space, one of time) that surrounds a criminal event. The sphere is centered on the event, and is largest in space when closest in time to the crime. The cone is smallest in space when closest in time, but ripples forward and back.
These are the results so far:
Spherical Fields
This was the initial idea, and it makes visual sense when animated. Drag the small gray slider at the top of this image back and forth to see how it works:
See a larger version of this view.
Red circles show a crime that is yet to happen, while blue circles show a crime that has already happened. The black dot in the center is visible only inside the sphere.
Conical Fields
Cones were the second idea, inspired by a conversation with Adam Greenfield which suggested that a ripple or light cone was a better visual metaphor. Here, the red circles start out large and converge or focus down to the crime before expanding again in blue:
See a larger version of this view.
The most confusing aspect of the conical version is that it still reads as big = close, which is not quite right. It should read as focused = close, so Eric and I experimented with a blurs to better suggest that the event is coming into and out of focus as you slide back and forth in time:
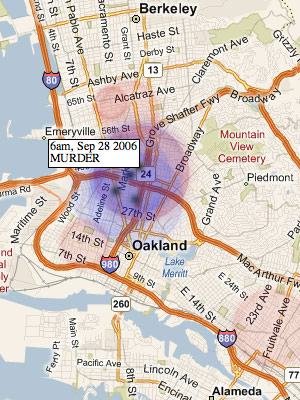
There are two versions of this interactive piece to play with full-screen, showing murders and prostitution. The second one is interesting, because it shows that prostitution arrests in West and East Oakland (along San Pablo and International Boulevards) occur in waves. The two areas are relatively quiet for days or weeks, then suddenly get hit with a block of arrests. I'm guessing this is due to planned and coordinated OPD vice squad activity. You can see examples of such waves on February 15, January 18, December 20, and December 14.
subscribe to ![]() this site.
|
contact Michal Migurski
this site.
|
contact Michal Migurski
Comments
Sorry, no new comments on old posts.