tecznotes
Michal Migurski's notebook, listening post, and soapbox. Subscribe to ![]() this blog.
Check out the rest of my site as well.
this blog.
Check out the rest of my site as well.
Jan 3, 2007 5:46am
oakland crime maps, part II
Last week, I described my first steps towards extracting usable location and crime detail information from Oakland's CrimeWatch II application. I showed how to access maps for specific times, places, and crimes in Oakland, and how to parse those maps for crime icons using simple visual feature extraction.
Since then, I've moved on to extracting more detailed information for those matched crime icons, and roughly geocoding them to within an acceptable distance of their true location. I'll describe more of the process in this post.
Linked downloads:
- Current python client: Crime.tar.gz (40K, requires additional libraries PIL, Numeric, and Twisted)
- SQLite 3 database of Oakland crimes, September through December 2006: crime.db.gz (732K)
My initial image parsing script, scan-image.py, could only extract crime locations from a single map. In order to get a full picture of events throughout the city, I would need to be able to access over a hundred maps for every day: eight city council districts (including Piedmont, where nothing ever happens) and fourteen types of crime ("arson", "alcohol", etc.), so the next step was to construct a client script that would be able manage a large number of map downloads. The first iteration of this client was a simple shell script, which placed JPEG files into a directory. After I ran this a few times, it became obvious that the long response times from the CrimeWatch server (20-40 seconds) were going to make testing tedious.
Instead of spending a lot of idle time waiting for requests to return,
I turned to Twisted Python for
an asynchronous framework that would manage multiple pending requests,
servicing each only as responses became available. I started by making
several modifications to the twisted.web.client.HTTPClientFactory
and twisted.web.client.HTTPPageGetter classes that would support
a persistent cookie jar, to make each request appear to be originating
from a single browser session. New map requests are dispatched every few
seconds, and the JPEG responses inspected immediately upon return.
This first iteration used a single cookie jar, and worked well up to the
map-parsing step.
I quickly discovered that retrieving details about individual crimes was going to require a different approach. The initial map requests result in an image map-like response, and details on individual crimes must be retrieved by clicking on map hot spots:
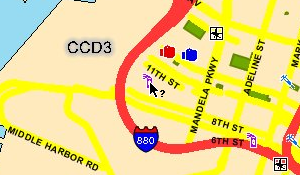
For each crime detail, a complete round-trip to the server must be made, a new map JPEG must be downloaded (it includes a mark showing the clicked spot), and two separate iframes (the first displays a "loading" message) must be requested to access the table of detailed information. My first attempt to get to these deeper details was done asynchronously, and I quickly noticed that I was seeing incorrect results due to a server-side session model that assumed each browser was accessing a single map at a time.
So, the final downloading agent begins a new session for each map. These are requested in parallel, but the resulting crimes for each are requested in serial, like this:
  ----+- map A, crime A1, ..., crime An
      |
      +--- map B, crime B1, ...
      |
      +----- map C, ...
      |
      +------- ...
The primary tool that makes this process tolerable is Twisted. It supports an asynchronous programming model that makes it a breeze to set up dozens of simultaneous browser sessions, and spread their requests out over time to avoid overloading the CrimeWatch server. It has been persistent fear of mine that this process would be nipped in the bud as soon as a CrimeWatch admin noticed my relentless pounding of their service from a single IP. That, and getting a knock on the door from the Oakland PD.
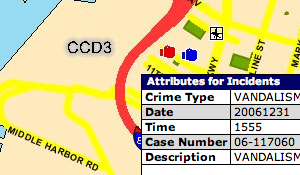
Scraping the crime detail table is performed by BeautifulSoup, another Python wonder-tool. This one is a loose HTML parser written by Leonard Richardson, and its handling of badly-mangled, invalid markup is truly heroic. Not everything in CrimeWatch's responses could be parsed out of HTML, unfortunately: several important details, such as the URLs of the iframes above, has to be regexped out of embedded javascript.
The next step in the process is geocoding each crime, assigning it a latitude and longitude based on its map location. CrimeWatch publishes no geographical information beyond the map images themselves, so this part is necessarily an approximation. Fortunately, CrimeWatch also promises that the data is only accurate to within the nearest city block, so the fudge-factor of geocoding events from an image is probably acceptable.
I'm taking advantage of the fact that the City Council District base maps remain static across requests, covering the same area regardless of the crime or time I'm searching for. This allowed me to search for reference points on each map that I could geocode manually. This was probably the most tedious part of the project, because I had to find three widely-spaced, well-rendered reference points for each district map. To find the location of map points, I used Pierre Gorissen's Google Map Lat/Lon Popup, a simple javascript application that places markers on Google Maps and reports their exact latitude and longitude. I chose three widely-spaced reference points for each district, such as these District 3 locations:
- Near Portview Park
Point on map, according to Photoshop: 466, 607
Latitude, longitude, according to Google Maps: 37.805775, -122.342656. - 14th St. & East 20th St.
Point on map: 1861, 862
Latitude, longitude: 37.793211, -122.240968. - Broadway & 51st St.
Point on map: 1719, 132
Latitude, longitude: 37.834429, -122.252373.
Using three such points and the assumption that the map is a linear projection (or close enough), determining the geographical positions of each crime placed on the map is a short bit of algebra. Cassidy tipped me off to the fact that the linear system can be represented by this pair of equations, where x and y are icon points on the map:
  latitude  = (a1 × x) + (b1 × y) + c1
  longitude = (a2 × x) + (b2 × y) + c2
Finding the a1, b1, c1, a2, b2, and c2 is possible by solving the following two systems, based on the three known points:
    37.805775 = (a1 ×  466) + (b1 × 607) + c1
    37.793211 = (a1 × 1861) + (b1 × 862) + c1
    37.834429 = (a1 × 1719) + (b1 × 132) + c1
  -122.342656 = (a2 ×  466) + (b2 × 607) + c2
  -122.240968 = (a2 × 1861) + (b2 × 862) + c2
  -122.252373 = (a2 × 1719) + (b2 × 132) + c2
This is described and implemented in some detail in the notes for a talk that Darren and I gave at Flash Forward NYC last year, Putting Data on the Map.
Finally, each named, dated, geolocated crime is written to a small database. SQLite has been a major godsend for this purpose, because it requires no configuration and is implemented as a simple library that reads and writes static files.
The end result of this process is a SQLite 3 database file containing crime incidents for all of Oakland from September, October, November, and December of 2006. I did a rough pass (14-day samples, with high risk of overlaps for common offenses, i.e. probably not as accurate as it could be) for those four months just to get the data, and I will be re-examining them in greater detail and retrieving additional data over the course of January.
subscribe to ![]() this site.
|
contact Michal Migurski
this site.
|
contact Michal Migurski
Comments
Sorry, no new comments on old posts.