tecznotes
Michal Migurski's notebook, listening post, and soapbox. Subscribe to ![]() this blog.
Check out the rest of my site as well.
this blog.
Check out the rest of my site as well.
Dec 29, 2006 4:26am
oakland crime maps
Update: I've written a followup to this post.
-
This has been a strange year to live in Oakland. The FBI says violent crime is up, but the City doesn't publish statistics in a particularly friendly format. Inspired by Adrian Holovaty's Chicago Crime, I'm in the process of exploring how the new CrimeWatch II application can be bent into a more usable shape.
This post describes the first two steps in extracting information out of CrimeWatch II: downloading known maps, and extracting positions of crime markers from those maps.
Linked text files:
- Example HTTP transcript: oaklandnet-http-transcript-02.txt (19K)
- Map request shell script: map-download.txt (6K)
- Example icon: vandalism.png (0.3K)
- Final icon matching script: scan-image.py (10K)
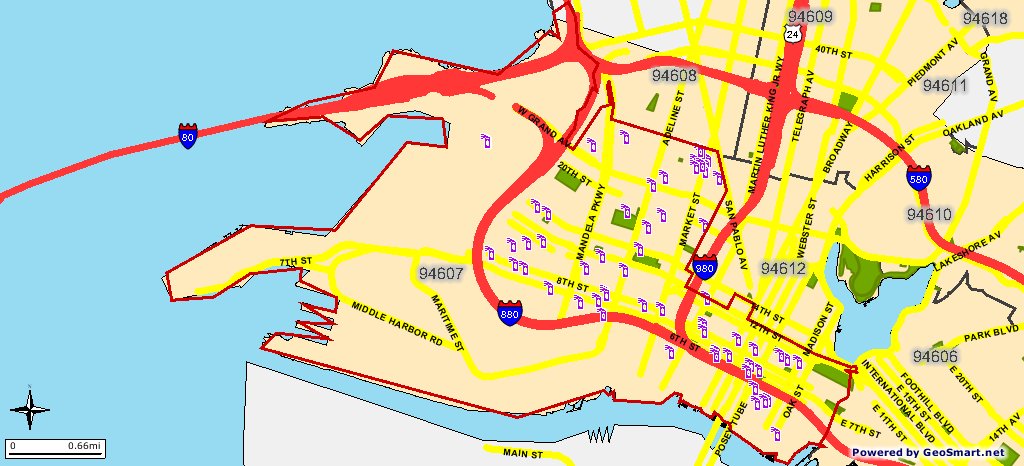
Initially, I had expected this to be a simple screen-scraping project, but as it turns out the available data is published in JPEG form as a series of icons overlaid on simple city maps:

Before attempting to geolocate individual crimes, it would be necessary to pick them out of the map image. Because the CrimeWatch application uses frames, cookies, background-images, and other techniques, it was first necessary to log HTTP traffic and understand what requests and parameters generated each map.
I used the FireFox plug-in LiveHTTPHeaders to pick apart the process of downloading a map. This resulted in an HTTP log such as this one. Getting maps from CrimeWatch is a three-step process: first they require that you accept their terms of use by posting a simple form response, then you choose your search parameters (e.g. zip code, crime type, dates, etc.), and finally you pick through the response HTML for a reference to the map JPEG. I created a basic shell script to walk through these steps. It uses cURL and some basic HTML-parsing Perl to find the map images.
GET /crimewatch/map.asp?mapfunction1=51…
Host: gismaps.oaklandnet.com
User-Agent: Mozilla/5.0 (Macintosh; U; …
Accept: text/xml,application/xml,applic…
Accept-Language: en-us,en;q=0.5
Accept-Encoding: gzip,deflate
Accept-Charset: ISO-8859-1,utf-8;q=0.7,…
Keep-Alive: 300
Connection: keep-alive
Referer: http://gismaps.oaklandnet.com/…
Cookie: OmegaCVCDisclaimer=yes; ASPSESS…

HTTP/1.x 200 OK
Date: Sat, 23 Dec 2006 22:35:36 GMT
Server: Microsoft-IIS/6.0
Content-Length: 1763
Content-Type: text/html
Cache-Control: private
Once the map image has been retrieved, it's necessary to pick through the returned image and identify the crime icons (see the right-hand legend in the screen shot). Because JPEG is a lossy-compression format and many icons occlude one another, it would not sufficient to search for exact pixel matches with the known set of icons. Instead, a more fuzzy, "best fit" method was needed.
I used Python with a combination of PIL and Numeric to extract icons from map images. I created average representations for each type of icon (e.g. "vandalism", PSD and PNG) based on maps with many instances of each.
Visual feature extraction is a two-step problem: quickly find a set of possible locations for icons, then check each in detail to determine if it's a match. The first step needs to eliminate as much background noise as possible for the more time-consuming second step to work quickly. I tried three different approaches before settling on one that seemed to work best.
A first, I tried to simply eliminate background pixels to cut down on the number of possible icon positions. It was easy to find representative colors for land, water, freeways, and parks, and eliminate about 70% of the total map pixels. With approximately 1-megapixel maps, this left about 300K pixels to check for icon matches, a prohibitively large number.
Next, I tried the opposite approach: find representative colors from each icon, and find likely locations based on the presence of those colors, rather than the absence of background colors. This means that I didn't spend a lot of time checking blue "simple assault" parts of the image for obviously-incorrect red "aggravated assault" icons. This was a major time savings, since most icons contain a representative color that appears little on the map. The exception to this rule is "robbery" and "burglary", two crimes that use black & white icons. Searches for these icons take dramatically longer than the others.
Finally, I expanded on the icon matches to better account for partially-occluded icons. When I encounter a possible match that's not strong enough to be included as a complete icon, but is still within about 50% of the threshold, I check the top, bottom, right, and left halves of the icon individually. If any of these result in an above-threshold match, I include them in the final results.
The final Python script takes about 2 minutes to convert the first linked image below into the second. Partially-occluded icons are marked with a light outline, fully-matched icons are marked with dark:
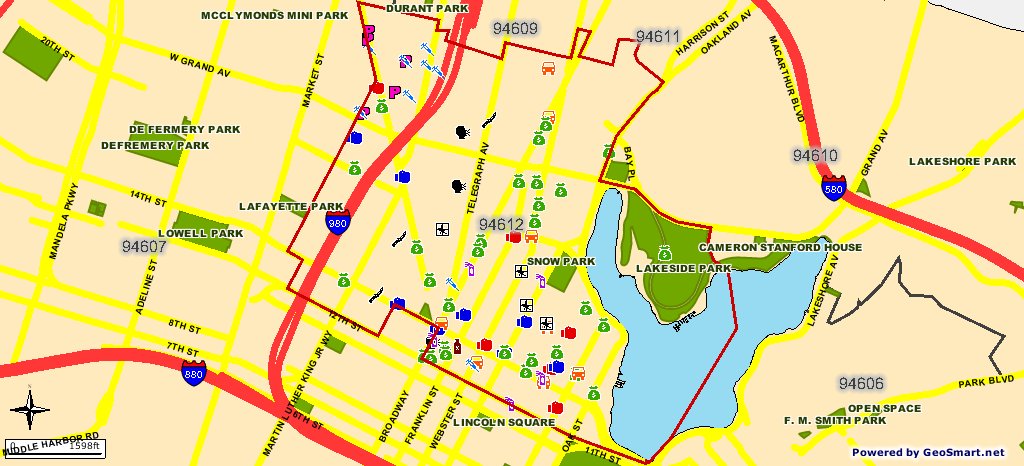
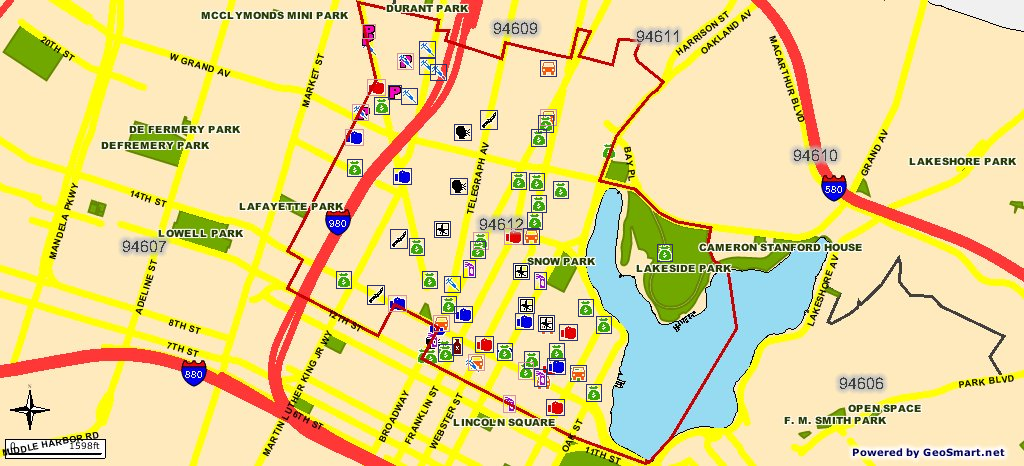
Although there are a few misses, the input image represents an unrealistic worst-case: two weeks' of data covering all possible crimes, with zip code boundaries visible. It is simple to request single-crime maps, with no boundaries, for one-day spans to cut down on the icon overlap.
There are two obvious next steps: use known addresses and intersections to geocode the matched icons (the CrimeWatch application promises only that they are placed at block-level accuracy), and make further HTTP requests for more detail about each crime, especially the time of day at which it was reported.
Also, it appears that the SFPD has recently switched to a crime mapping application developed by the same vendors, Omega Group and MoosePoint (!), so expanding this process to cover San Francisco should be easy.
-
Keep reading the followup to this post.
subscribe to ![]() this site.
|
contact Michal Migurski
this site.
|
contact Michal Migurski
Comments
Sorry, no new comments on old posts.