tecznotes
Michal Migurski's notebook, listening post, and soapbox. Subscribe to ![]() this blog.
Check out the rest of my site as well.
this blog.
Check out the rest of my site as well.
Feb 28, 2013 12:03am
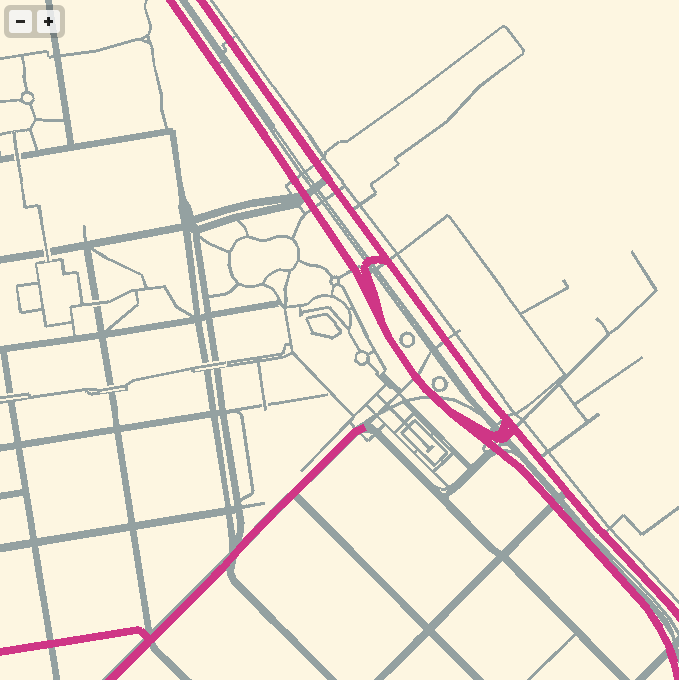
gl-solar, webGL rendering of OSM data
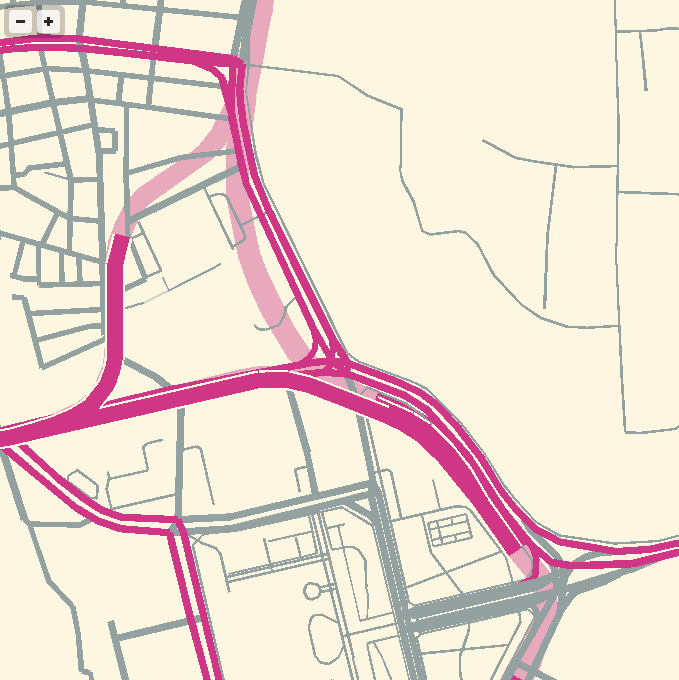
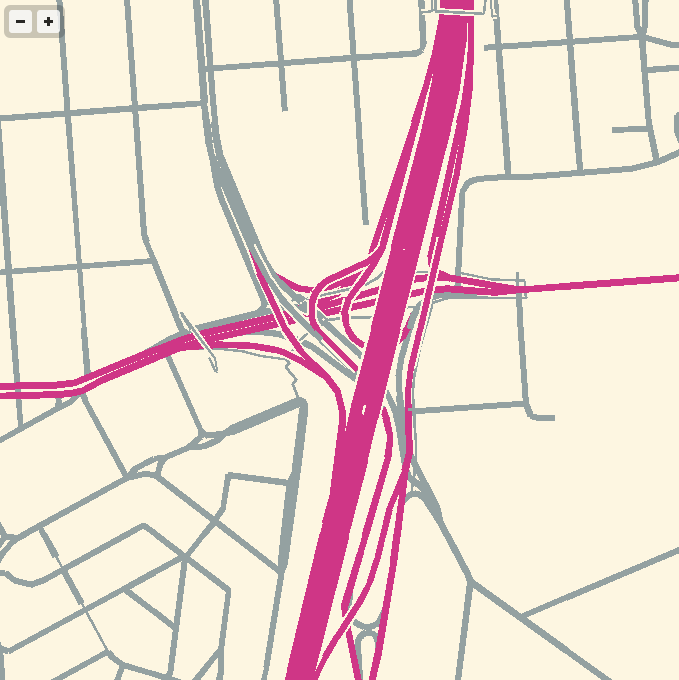
I’ve been experimenting with WebGL rendering of vector tiles from OpenStreetMap, and the results so far have been quite good.
Techniques for fast, in-browser drawing of street centerlines have interested me since I looked closely at the new iOS Google Maps, which uses vector rendering to achieve good-looking maps on the small screen of a phone.
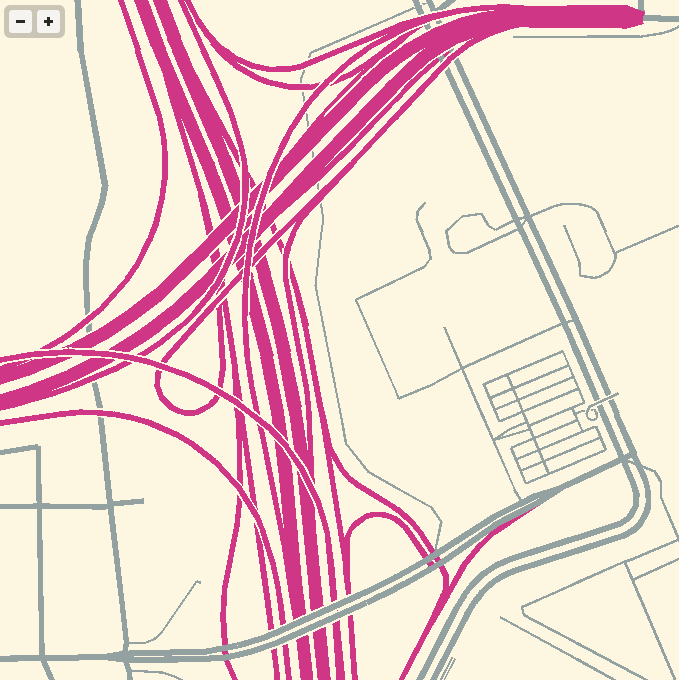
While Google seems to have aimed for an exact duplicate of their high-quality raster cartography in a more interactive package, I’ve been playing with the visual aesthetics of aliased edges and single, flat expanses of color. The jaggies along the edge of Facebook’s parking lot in the screen above remind me of early 1990s side-by-side print quality comparisons from Macworld, except I always preferred the digitally-butchered woodcut edges in the 200dpi samples to the too-perfect reproduction in the 600dpi+ version. At the very moment that they’re disappearing into a retinal haze, pixels are looking good again.
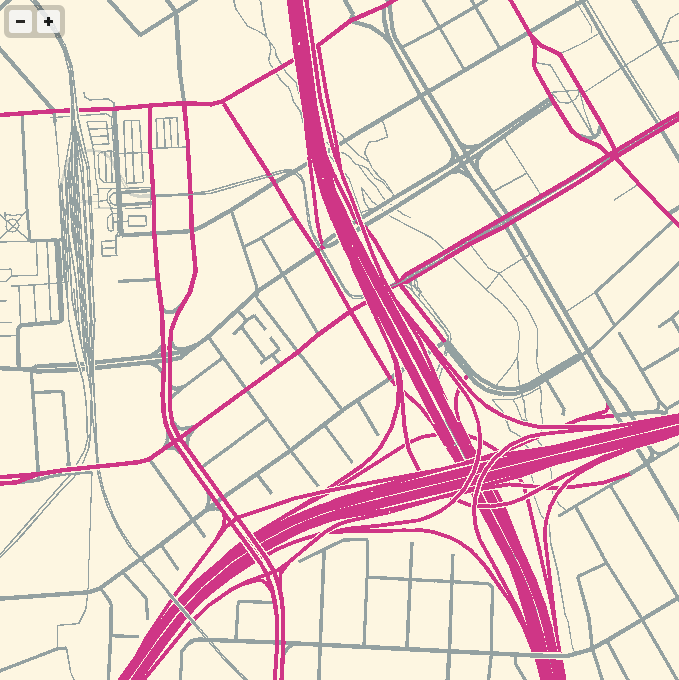
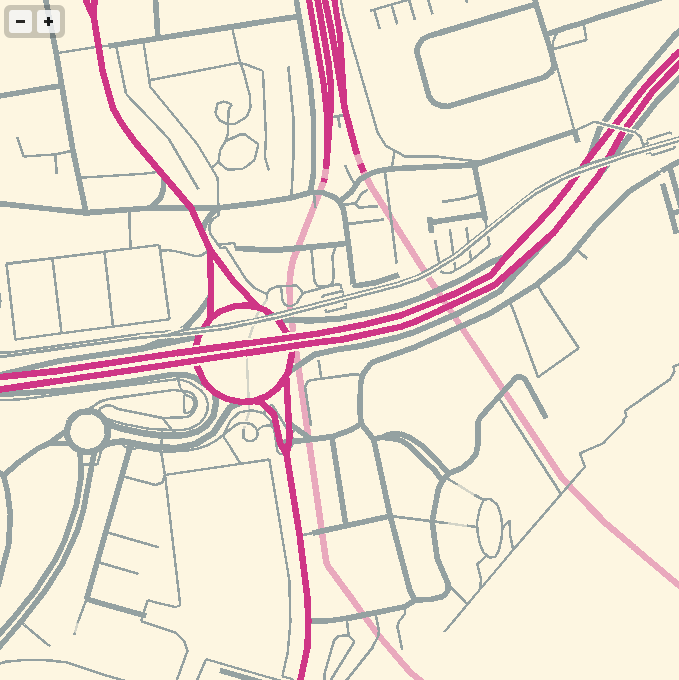
The colors here are all transposed from OSM-Solar, my cartographic application of Ethan Schoonover’s Solarized, a sixteen color palette (eight monotones, eight accent colors) designed for use with terminal and gui applications.
For the depth-sorting of roads and correct display of under- and overpasses, I’m using the “layer” metadata found in some OSM objects and my own High Road OSM queries. WebGL is amazing for this, because all the actual sorting is happening in the vertex shader where it can happen quickly and in parallel.
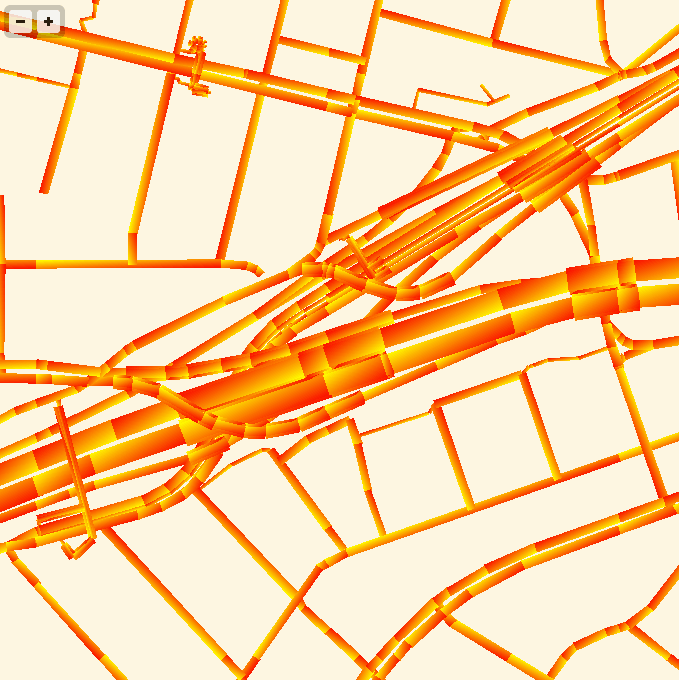
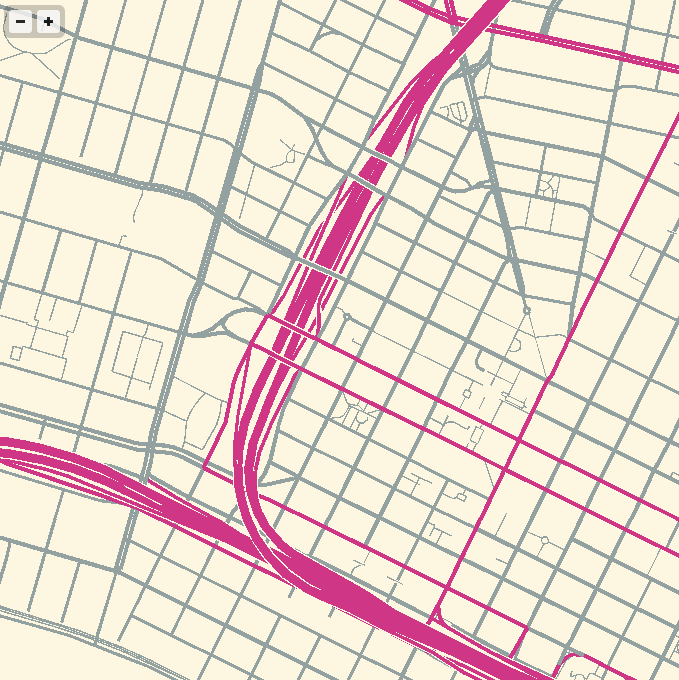
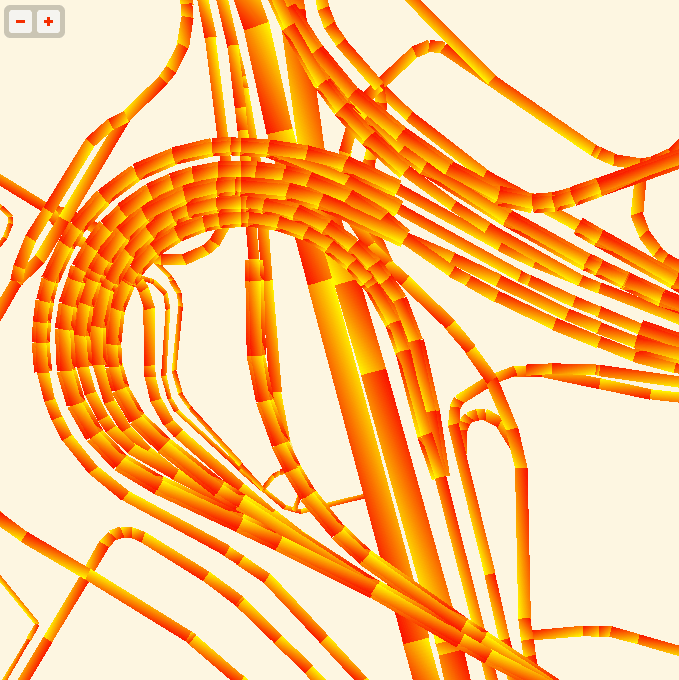
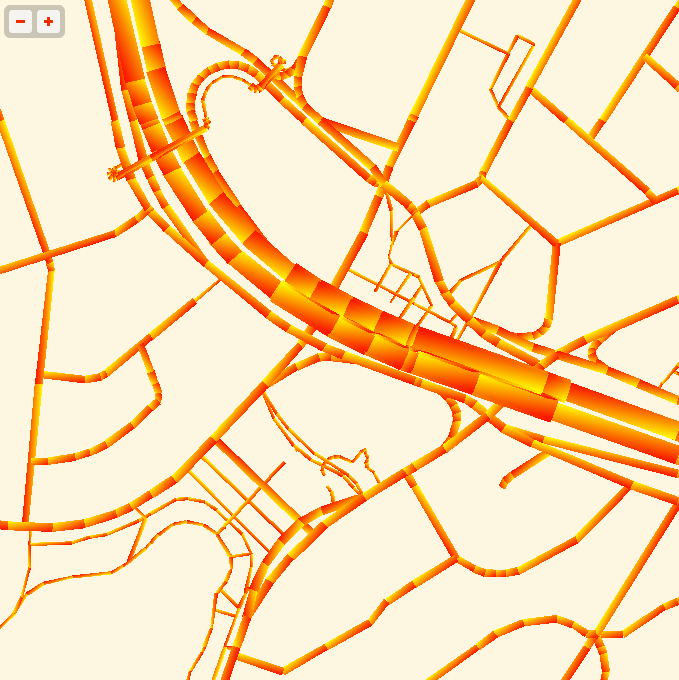
The road widths are being calculated manually, based on simplified centerline geometries found in GeoJSON tiles. I’m inflating each road type by a variable amount, manually creating my own line joins and caps. The image above is from the false color edition, which shows much more clearly how the line widths are being constructed. Javascript is reasonably fast at this basic trigonometry, but I had to move this part of the code into a web worker to cut down on animation glitches.
The panning and zooming smoothness are astonishing; overall I’ve been very happy with performance. One challenge that I’d like to address is the breakdown in floating point precision at zoom level 18. Four-byte floats have a 24-bit significand, which allows for pixel-perfection only up to zoom level 16 on a world map. The effect is relatively subtle at zoom 17, but glaringly obvious and a big problem at 18. I like the visual appearance of the aliased lines, but they wouldn’t be appropriate for everyday use of a map.
I imagine at some point I will need to add buildings, water and labels. One step at a time. The code for this demo is available on Github, and the correct link for the demo itself is http://teczno.com/squares/GL-Solar/.
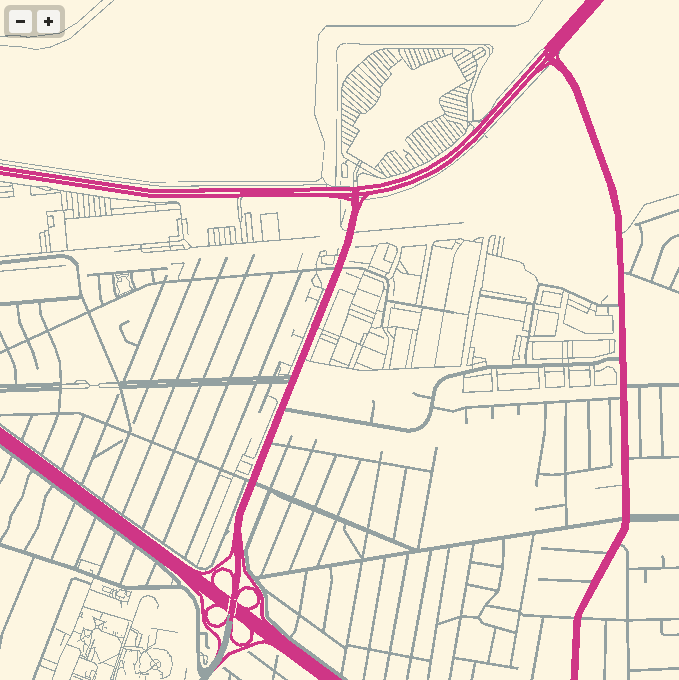
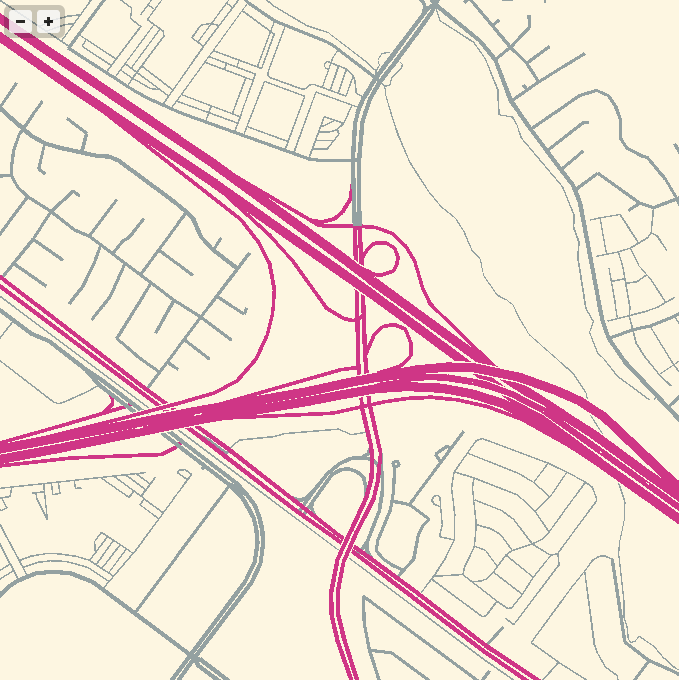
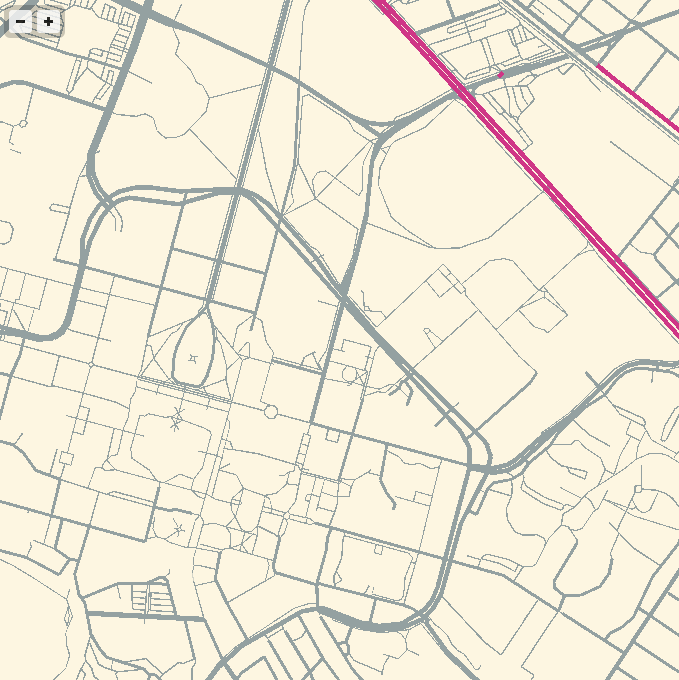
More sample screen shots below.

subscribe to ![]() this site.
|
contact Michal Migurski
this site.
|
contact Michal Migurski