tecznotes
Michal Migurski's notebook, listening post, and soapbox. Subscribe to ![]() this blog.
Check out the rest of my site as well.
this blog.
Check out the rest of my site as well.
Oct 29, 2012 7:15am
the city from the valley: shuttle project for zero1
Last weekend, I participating in a panel on data and citizen sensors for the Urban Prototyping Festival. Our moderator was Peter Hirshberg, with co-panelists Sha Hwang, Genevieve Hoffman, Shannon Spanhake and Jeff Risom:
Urban Insights: Learning about Cities from Data & Citizen Sensors. Collection and visualization of urban data have quickly become powerful tools for municipal governance. Citizens now have the capacity to act as sensors, data analysts, information designers, or all of the above to help cities better understand themselves. This panel will focus on the evolving role of open data and its applications to the public sector.
In thinking about how to talk about data collection, I wanted to highlight a recent project that we at Stamen did for the Zero1 festival in San Jose, The City from the Valley: “An alternate transportation network of private buses—fully equipped with wifi—thus threads daily through San Francisco, picking up workers at unmarked bus stops (though many coexist in digital space), carrying them southward via the commuter lanes of the 101 and 280 freeways, and eventually delivers them to their campuses.”
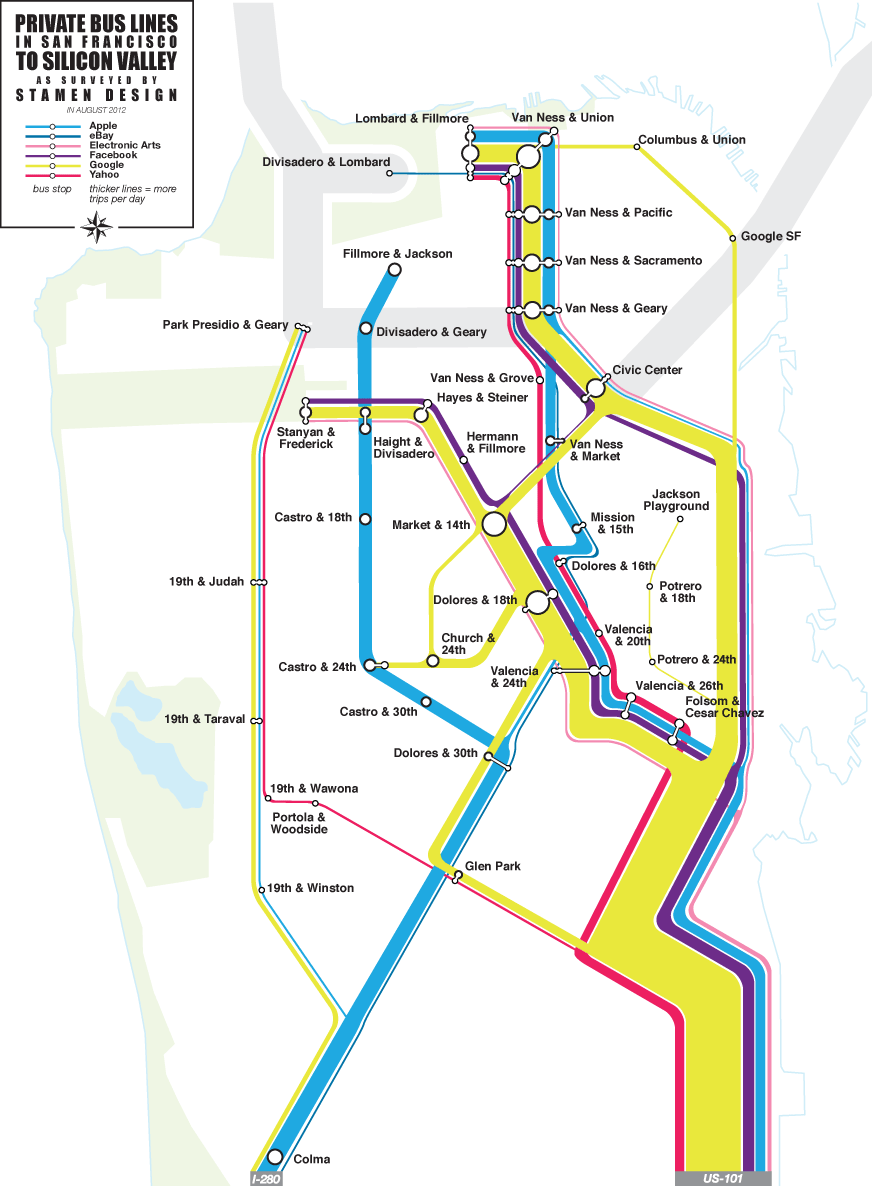
I’ve been fascinated by these buses for a few years now, first realizing the extent of the network over periodic Mission breakfast with Aaron. We’d drink our coffee and watch one after another after another gleaming white shuttle bus make its way up Valencia. I’d hear from friends about how the presence of the shuttles was driving SF real estate prices, and as a longtime Mission district weekday occupant the change in the local business ecology is unmissable.
The results of our observations suggest that this network of private shuttles carries about 1/3rd of Caltrain’s ridership every day, a huge number. I’m not sure myself of the best way to look at it. It’s clearly better to have people on transit instead of personal cars, but have we accidentally turned San Francisco into a bedroom community for the south bay instead?
According to a survey by the San Francisco County Transportation Authority, 80 percent of people riding the shuttles said they would be driving to work or otherwise wouldn't be able to live in San Francisco if they couldn't get the company-sponsored rides to work. —SF Supervisor Proposes Strict Regulations For Corporate Shuttles.
What of the Mission district, whose transformation into an artisinal brunch wonderland I’ve found aesthetically challenging? Maybe more significantly, what of the private perks offered by valley companies, of which private transport is just one? I think Google, Facebook, Apple and others have all done their own math and determined that it’s advantageous to move, feed, clothe, and generally coddle your workforce. This math scales a lot more than is obvious, and as a country we should be looking at things like the Affordable Care Act in a more favorable light, perhaps asking companies who need to move employees up and down the peninsula to pay more into Caltrain instead of running their own fleets. Election time is near, and even though my mind is made up the public vs. private debate in this country remains wide open. Am I comfortable with a Bay Area where the best-paid workers are also subject to a distorted view of reality, having their most basic needs passively met while those not lucky enough to work in the search ad mines have to seek out everything for themselves? Privilege is driving a smooth road and not even knowing it.
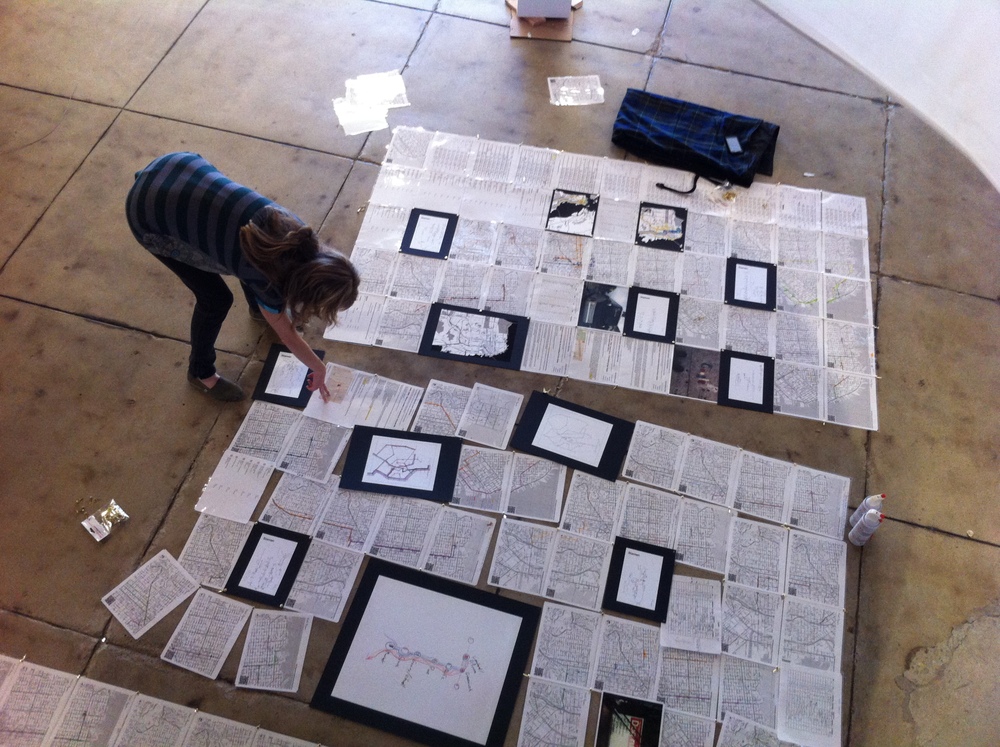
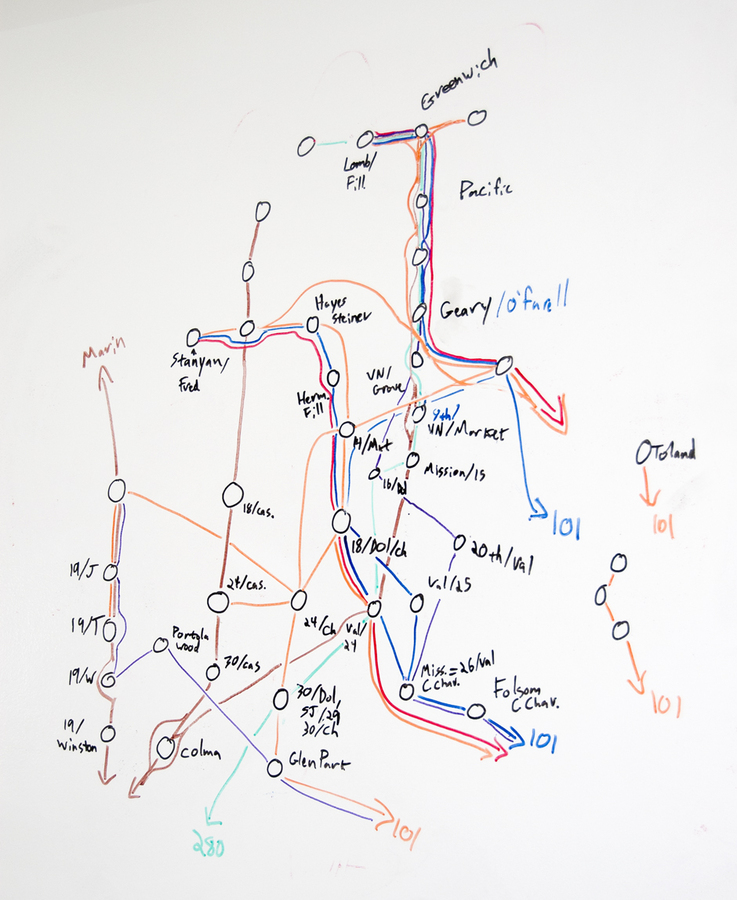
This fascination, by the way, is my total contribution to the project—once we all decided that the buses were worth exploring and after Eric, George and I had spent a morning counting them from the corner of 18th & Dolores to make sure we weren’t crazy, the gears of the studio kicked in and the project was born. Nathaniel and Julie worked with local couriers to track sample routes, and we used Field Papers to note passenger counts and stops. Zach looked at Foursquare checkins for clues. Nathaniel and Zach created the flow map above to illustrate our guesses at ridership and routes, and the whole thing went up in San Jose last month:
Oct 7, 2012 6:50pm
openstreetmap in postgres
I was chatting with Sha this weekend about how to get data out of OpenStreetMap and into a database, and realized that it’s possible no one’s really explained a full range of current options in the past few years. Like a lot of things with OSM, information about this topic is plentiful but rarely collected in one place, and often consists of half-tested theories, rumors, and trace amounts of accurate fact based on personal experience earned in a hurry while at the point of loaded yak.
At first glance, OSM data and Postgres (specifically PostGIS) seem like a natural, easy fit for one another: OSM is vector data, PostGIS stores vector data. OSM has usernames and dates-modified, PostGIS has columns for storing those things in tables. OSM is a worldwide dataset, PostGIS has fast spatial indexes to get to the part you want. When you get to OSM’s free-form tags, though, the row/column model of Postgres stops making sense and you start to reach for linking tables or advanced features like hstore.
There are three basic tools for working with OSM data, and they fall along a continuum from raw data on one end to render-ready map linework on the other.
Osmosis
Osmosis is the granddaddy of OpenStreetMap tools:
The tool consists of a series of pluggable components that can be chained together to perform a larger operation. For example, it has components for reading from database and from file, components for writing to database and to file, components for deriving and applying change sets to data sources, components for sorting data, etc.
Mostly Osmosis is used to retrieve full planet dumps or local extracts of OSM data and convert it to various formats, strip it of certain features, or merge multiple parts together. Osmosis can write to Postgres using a snapshot schema, with nodes stored as real PostGIS point geometries and ways optionally stored as Linestrings. OSM tags are stored in hstore columns as key/value mappings. User information goes into a separate table.
The Osmosis snapshot schema is great if you want:
- Original nodes and you don’t care what streets they’re a part of.
- Metadata about OSM such as owners of particular ways.
- Downstream extracts from your database.
Snapshot schema tables: nodes (geometry), ways (optional geometry), relation_members, relations, schema_info, users, way_nodes.
I’m fairly new to Osmosis myself, just starting to get my head around its pitfalls.
Osm2pgsql
Osm2pgsql is in common use for cartography, “often used to render OSM data visually using Mapnik, as Mapnik can query PostgreSQL for map data.” Osm2pgsql is lossy, and you can tweak its terribly-named “style file” to decide which original tags you want to keep for rendering. Tags are converted into Postgres column names, with newer versions of Osm2pgsql also supporting the use of hstore to save complete tag sets. Data ends up in three main tables, grouped into points, lines and polygons.
Osm2pgsql will get you:
- An easy, no-configuration direct import organized by geometry type.
- Reasonably fast selections and renders by Mapnik.
- Automatic spherical mercator projection.
- A list of affected tiles if you use it on a changeset.
I’ve never successfully run Osm2pgsql without using the “slim” option, which stores additional data in Postgres and makes it possible apply changes later. Osm2pgsql tables: point (geometry), line (geometry), polygon (geometry), nodes (data), rels (data), ways (data), roads (never used this one).
I’ve included ready-to-use shapefiles of Osm2pgsql data in the Metro Extracts.
Imposm
Imposm is at the far end of the scale, producing topic-specific tables that you define.
Imposm is an importer for OpenStreetMap data. It reads XML and PBF files and can import the data into PostgreSQL/PostGIS databases. It is designed to create databases that are optimized for rendering/WMS services.
Where Osm2pgsql gets you a single table for all linestrings, Imposm can give you a table for roads, another for rail, a third for transit points, and so on. It does this by using a mapping file written in Python which selects groups of tags to map to individual tables. Imposm can perform a ton of upfront work to make your downstream Mapnik rendering go faster, and requires significantly more data preparation effort if you want to depart from default schemas. I’ve been working on an all-purpose mapping based on High Road just to make this easier. The cost of upfront work is tempered somewhat by Imposm’s use of concurrency and its separation of database population from deployment, something you normally do manually in Osm2pgsql.
Imposm is great for:
- Faster, smaller, more render-ready data.
- Automatic simplified geometry tables.
Use it if you’re working on cartography and already know how you want to map OSM data. I’ve had good experiences using Osm2pgsql together with Imposm, building up complex queries from generic Osm2pgsql data and then translating them into Imposm mappings. I’ve also been using it to perform street name abbreviations at import time, greatly improving the visual quality of road names in final maps.
Sample tables from my own mapping: green_areas, places, buildings, water_areas, roads and rails divided up by zoom level.
I’ve included ready-to-use shapefiles of Imposm data in the Metro Extracts.
Takeaway
Use Osmosis if you’re interested in data. Start with Osm2pgsql if you want to render maps. Move to Imposm once you know exactly what you want.
Oct 7, 2012 7:36am
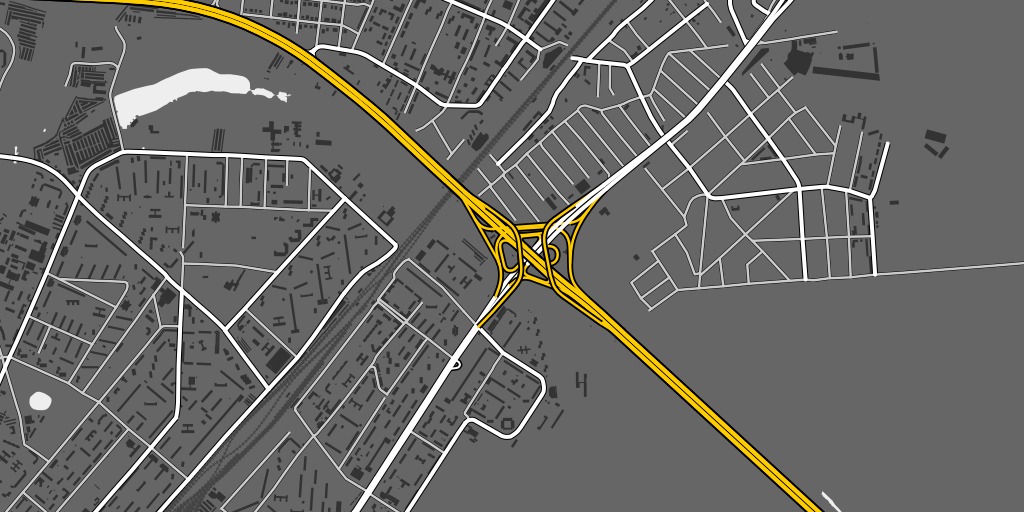
maps of lake merritt
Lake Merritt might be the Lenna of online cartography samples. Only one of these comes from someone who actually lives in Oakland:
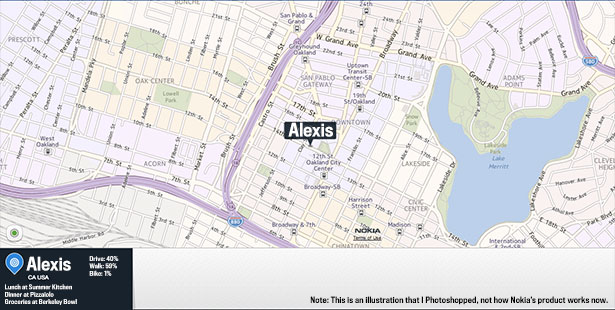
—Alexis Madrigal in The Atlantic, The Forgotten Mapmaker.
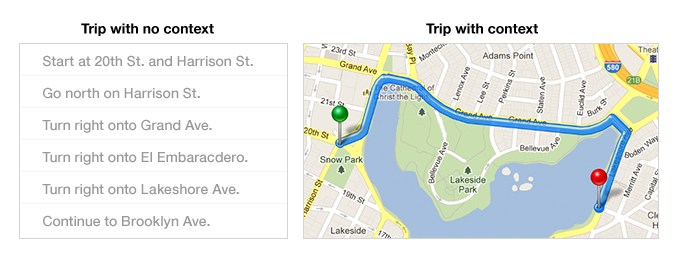
—Bret Victor on Learnable Programming.
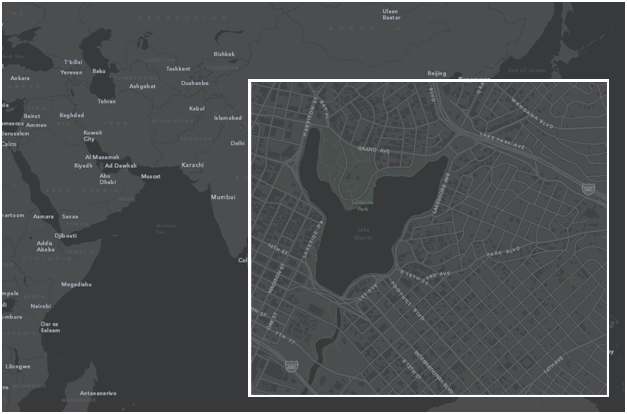
—Mamata Akella on Esri Canvas Maps.
subscribe to ![]() this site.
|
contact Michal Migurski
this site.
|
contact Michal Migurski