tecznotes
Michal Migurski's notebook, listening post, and soapbox. Subscribe to ![]() this blog.
Check out the rest of my site as well.
this blog.
Check out the rest of my site as well.
Mar 11, 2012 6:39pm
county papers
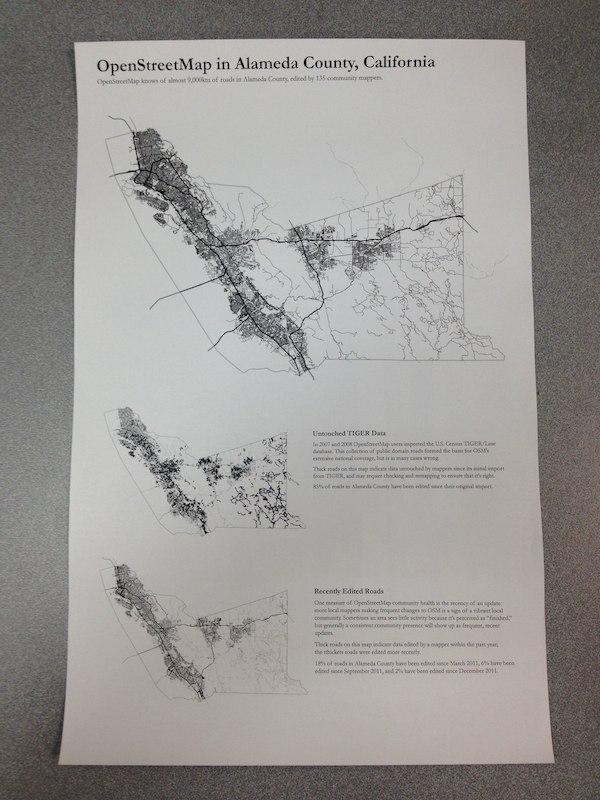
I’ve been playing with ways to represent U.S. OSM involvement at the county level. This is in part spurred by some of Thea Aldrich’s work since the last State Of The Map U.S. as well as by Martijn Van Exel’s Temperature of local OpenStreetMap Communities. The county-equivalent is a basic unit of administrative power, a common baseline for Census demographic statistics, often home to GIS professionals, and guaranteed to cover any given piece of land in the United States. It’s a great way to divide a dataset like OpenStreetMap, so I’ve started to experiment with useful print representations of counties for looking at map coverage.
(PDF download, 21MB)
The visual design is rather primitive so far, with just three maps on a single tabloid printout as a quick test. At top is a basic representation of OSM coverage, a sort of “what do we know” for streets. Next is a map of TIGER/Line status, highlighting streets which remain untouched since their initial import in 2007 and probably overdue for review. Finally, a map showing recently-edited streets, which looks a little more interesting the Austin, Texas render. Each is rendered using Mapnik and Cairo’s PDF output from a recent OSM Planet extract.
There are intentional echoes of Newspaper Club’s Data.gov.uk Newspaper here.
My afternoon test prints suggest a few things:
- Printers have a very hard time with fine linework, so I’m switching to halftones for the smaller maps.
- I need to get many more layers of information in there, including buildings, parks, points of interest, etc.
- Maps will look better when printed large.
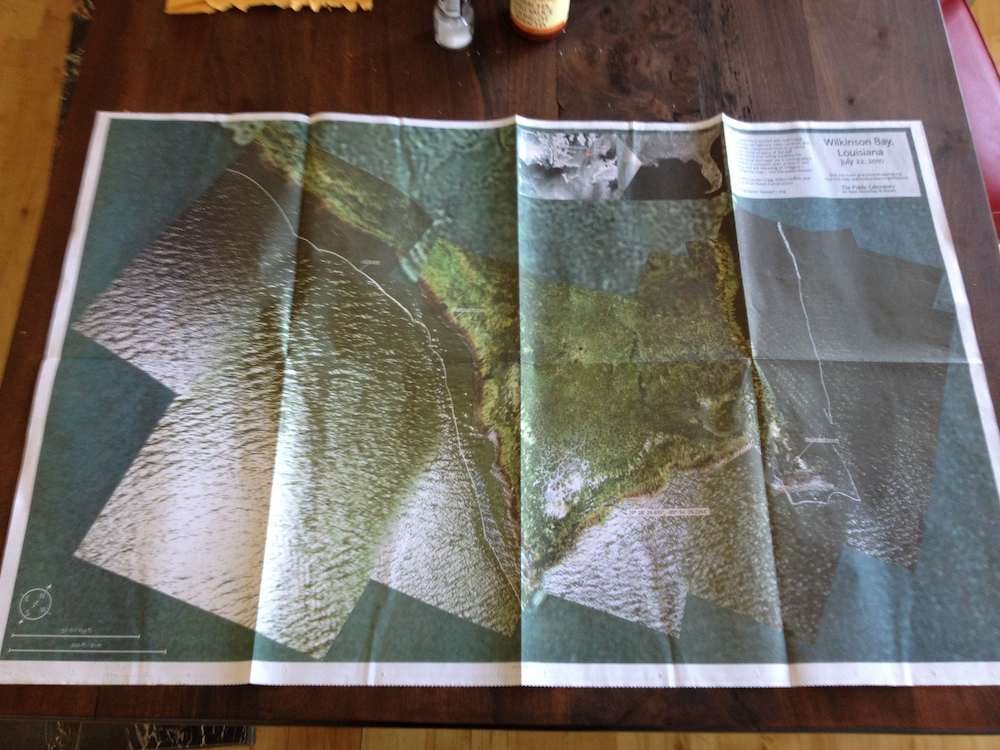
- I should do a newspaper run like Grassroots Mapping did recently, the output looks great:
Code can be found in Github under CountyOSM. You are not expected to understand it.


Comments
Sorry, no new comments on old posts.