tecznotes
Michal Migurski's notebook, listening post, and soapbox. Subscribe to ![]() this blog.
Check out the rest of my site as well.
this blog.
Check out the rest of my site as well.
Jan 2, 2007 4:26am
3000
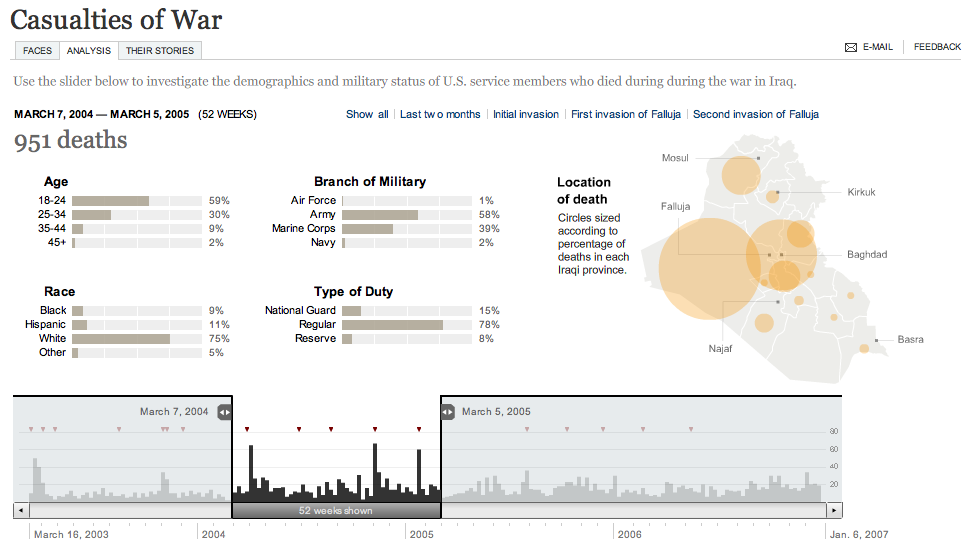
The New York Times has published 3000 Faces, an interactive infographic of U.S. military casualties in the Iraq War, to-date:
Try the application at nytimes.com.
Casualties are classified according to age, race, service, duty, and time and location of death. The primary control for the graph affords selection of a variably-sized slice in time, for example the 52 weeks I have chosen in the screenshot above, between March 2004 and March 2005. This is the heaviest continuous one-year stretch of the war, encompassing the beginning of the campaign against al-Sadr, the second invasion of Fallujah, and the January 2005 Marine helicopter crash that killed 31.
All aspects of the chart react to the time slider: the date at top changes, breakdown charts in the middle adjust themselves, and location circles in the map on the right scale accordingly.
The time interface serves three functions:
- It's a bar chart displaying the casualties per week over the almost four-year course of the war.
- Small markers at the top note significant events, e.g. "Constitution approved" or "Saddam Hussein captured."
- Input widget, for modifying the remainder of the graph.
The combination of display and interface in the time slider is strongly influenced by Google Finance:

Google Finance's central line graph also serves the same three functions: stock price display, news event markers, and input slider.
The entire casualty analysis application makes liberal use of tooltip-style information displays, which display detailed statistical information above the looser, less-detailed graphics:
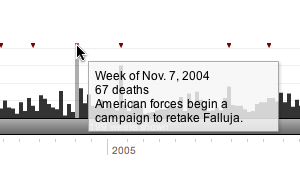
Daniele Galiffa of Mentegrafica compares it to Minard's Napoleon's Retreat chart made famous by years of magazine advertisements for Edward Tufte seminars. He also says that improved understanding would result from additional data-mining features ("what was the worst day for white men?"), but I disagree. The tooltips demonstrate how selective hiding of information helps increase the overall information density of the graph, and the single input mechanism makes it a more accessible browsing tool for historical information. The pertinent information here is event-based, answering questions about the spikes in the chart, and offering direct links to significant points in the upper-right-hand corner. The one significant feature missing is the capacity to bookmark views into the data. Fortunately, there are only two possible variables for each view (start date, end date), but it would be interesting to provide a direct URL to the 52 weeks of heaviest casualties, above. For comparison, Google Finance also offers no way to link to a particular view that I'm aware of. Yahoo's new beta Finance charts do offer the fragment-style direct links first demonstrated by Kevin Lynch (e.g. this view of the same HAL data as the Google screenshot above), at the cost of an otherwise heavily over-featured application.
Martin Wattenberg and Fernanda Viegas's group at IBM is also doing some work in this direction, with their forthcoming Many Eyes project (look for "democratizing visualization" on this page). The two central features of Many Eyes that pique my interest are thumbnails and direct links to application states, simple technical additions that greatly multiply the usefulness of the application as a vehicle for argumentation or simple sharing.
Overall, I think the New York Times application is an example of serious, cutting-edge journalism, offering readers (?) a way to make and test theories about the progress of a long-term event. It's valuable in the same way as the terror alert vs. approval rating chart, and for many of the same reasons. The barrage of noise generated by the 24-hour news cycle is desperately in need of simplifying views that help illustrate co-occurence and possible causality of news events.
In contrast, John Emerson offers his own take on the latest milestone.
subscribe to ![]() this site.
|
contact Michal Migurski
this site.
|
contact Michal Migurski
Comments
Sorry, no new comments on old posts.