tecznotes
Michal Migurski's notebook, listening post, and soapbox. Subscribe to ![]() this blog.
Check out the rest of my site as well.
this blog.
Check out the rest of my site as well.
Aug 17, 2010 5:21pm
presenting tilestache
Named in the spirit of the pun-driven life, TileStache is a response to a few years of working with tile-based map geographic data and cartography, and an answer to certain limitations I've encountered in MetaCarta's venerable TileCache.
The edges I've bumped into might be esoteric, but I think they're also indicative of our many experiments in tile-based web mapping since 2007. The core functional needs of a tiling system are well handled by existing software: imagery from bitmap sources of aerial and scanned imagery, Mapnik renderings of OpenStreetMap data, and caches of remote WMS tiles. None of this is really the core point of TileStache, though it's all certainly table stakes.
The place where I've found a need for a new project is somewhere in the intersection between synthetic imagery, composites of existing imagery, and delivery of raw vector data to browsers. More and more we're dealing with the expressive possibilities of new web cartography in project like Pretty Maps, and TileStache is a possible approach to data publishing that borrows a lot of the simplicity of TileCache while adding a dose of designed-in extensibility for creating new kinds of maps.
Isotiles
After developing Travel Time Maps with MySociety in 2008, we adapted our bitmap data imagery technique to tiled delivery. The follow-on Mapumental project hypothetically covers the entirety of the UK with dynamic, temporal data.
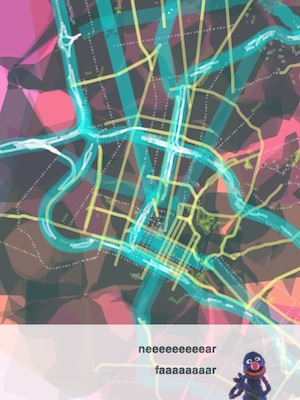
Here's a screenshot from one of the early demos, showing travel times around a city, lit up over the coastline:

It's not animated (check the Channel4 site for a video of Mapumental), but this is one of the constituent map tiles underlying the image:

Each pixel in this tile is a 24-bit value encoded in the red, green, and blue channels, expressing a time and speedily decoded by the Flash application in the browser. This part of the project is driven by a custom Layer class in TileCache, that pulls pre-computed time points (e.g. transit stations) from a database and renders cones around them. Some of the code might be findable in MySociety's source repository.
What's interesting here is the idea of completely synthetic providers, i.e. those not directly based on GDAL sources, Mapnik renderings, or WMS servers. It's something I'm demonstrating in the TileStache Grid provider, an implementation of the UTM grid (U.S. National Grid and Military Grid Reference System) for overlay onto other spherical mercator maps.
Composites
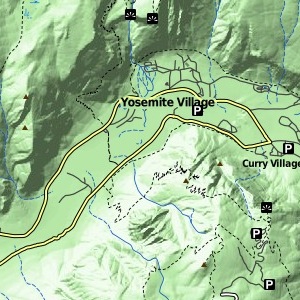
Lars Ahlzen's TopOSM is a longtime rendering project based on OpenStreetMap data and cartography built from constituent pieces of Mapnik. TopOSM combines renderings of streets, hills, and labels to create a beautiful, dimensional result:
Lars builds the final map up from a stack of images, many of which might themselves be expressed as tile layers:
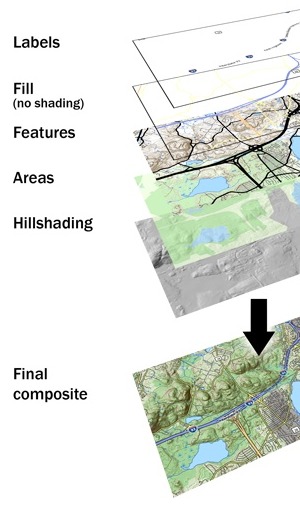
In attempting to build a new Layer class for TileCache that expresses this idea, I found that it seemed to be impossible to access the full configuration of the system from within a given layer. There was no way to create a derived map sandwich, and I knew that Lars's own method was a homebrew of ImageMagick and similar tools. I'm interested in something a bit more systematic that implements something like Photoshop layers for cartography. The current Composite provider in TileStache provides layers, alpha channels, color fills and masks, and I'd like to implement transfer modes (e.g. Photoshop's hard light) if this sample proves to be interesting.
We've delivered this sort of composite cartography to clients in the past, but always through a combination of spit and chewing gum.
GeoJSON Data
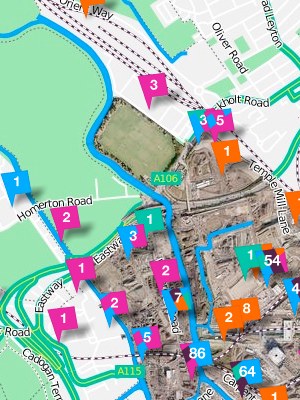
Most recently, we've been developing Polymaps, an SVG-based map engine that can show regular image tiles in combination with vector overlays driven by GeoJSON data. Tiles turn out to be just as helpful for publishing and requesting vector data as they are for pixel-based images. We've modified TileCache to support this use in the past, but there are simply too many places where the code assumes pixel-based images for the exercise to be anything but frustrating. TileStache is designed to accommodate data-only tiles, including an example PostGeoJSON provider that converts PostGIS data to GeoJSON.
As the ability of browsers to interpret and display a wider variety of imagery improves, we're going to see this data tile concept become increasingly useful. Why stop at image tiles, when you might want to render roads that can be rolled-over or clicked directly? Why assume dynamic data services, when TMS-style tile URLs (e.g. */12/656/1582.png) can be hosted from simple storage services or plain filesystems?
Anyway.
It's early days, but we're finding that the limitations around in-browser display of layers and data are increasingly down to the display of SVG or Canvas rather than any particular native slowness in Javascript itself, so we're thinking that our still-fairly-intensive experimental demos getting a few kinds words from friends like Nathan, Alyssa, and Jen will calmly scroll into the window of normalcy within the next year or so. We also know that other developers are thinking about some of the same concerns that the motivating goodies above address. For example, Dane tells me that the current bleeding edge of the map-rendering library Mapnik includes basic image compositing, masking, and GeoJSON output right there in the core.
Really what we're looking at is a future filled with work like Brett Camper's amazing 8-Bit Cities, "an attempt to make the city feel foreign yet familiar ... to evoke the same urge for exploration, abstract sense of scale, and perhaps most importantly unbounded excitement."
What are the tools that help make this possible?

subscribe to ![]() this site.
|
contact Michal Migurski
this site.
|
contact Michal Migurski