tecznotes
Michal Migurski's notebook, listening post, and soapbox. Subscribe to ![]() this blog.
Check out the rest of my site as well.
this blog.
Check out the rest of my site as well.
Aug 21, 2010 6:42pm
release often
A few code-like things I've been working on lately.
Polymaps
Polymaps is a result of our summerlong collaboration with SimpleGeo. We've been working on it for some time, but yesterday we announced it for realsies and saw an amazing response from all over the internet. This one's been doubly rewarding for us, since it's also the result of a summerlong collaboration with Mike Bostock of Protovis fame. Mike's been on our radar since he showed off Protovis when Tom and I visited Stanford a while back. It was a week-old at the time and already full of promise. This Javascript thing, I think it will go far.
Census Tools
Census Tools is a small thing I put together last week, to extract data from the 2000 U.S. Census by subject and geography. I've just added the ludicrously detailed Summary File 3 with loads of information on housing, commutes, and other topics. Also, Shawn added a second script, text2geojson.py, which converts the textual output of census2text.py into neatly-formed GeoJSON. This makes it trivially compatible with PolyMaps!
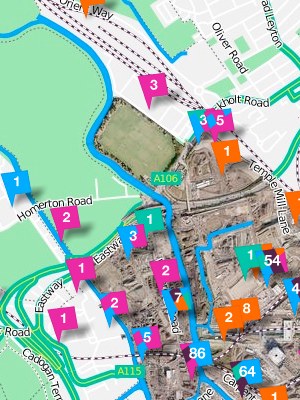
Walking Papers
Walking Papers gained two new translations recently. Maxim Dubinin provided a complete version of the site in Russian, while Frank Eriksson has been working on it in Swedish. This will bring our total number of languages to ten, and it's a fascinating case study in the power of using Git (and Github) for open source projects. Generally speaking, most of the translators haven't had to ask for permission or even informed me of their work until they were basically done. A staging site and a few git pulls later and we've got a new translation!
Maxim who did the Russian version was the first person to translate the title of the project in addition to the text content. He said they had a pretty good pun going as well:
Well, as I recall, "walking papers" are docs you're getting when you're fired, right? Turns out "Обходной лист" is exactly the same thing in russian - a piece of paper ("лист"), that you're getting when you're fired and use to "walk around people" ("обходить") in your org collecting signatures that you returned what you had too etc, so it is means almost exactly the same. Funny that that you can literally translate some idioms and they will still make sense. In the context of OSM I guess it translates as well you walk around, now geographically, not people wise and it is a piece of paper :)
So good.
Aug 17, 2010 5:21pm
presenting tilestache
Named in the spirit of the pun-driven life, TileStache is a response to a few years of working with tile-based map geographic data and cartography, and an answer to certain limitations I've encountered in MetaCarta's venerable TileCache.
The edges I've bumped into might be esoteric, but I think they're also indicative of our many experiments in tile-based web mapping since 2007. The core functional needs of a tiling system are well handled by existing software: imagery from bitmap sources of aerial and scanned imagery, Mapnik renderings of OpenStreetMap data, and caches of remote WMS tiles. None of this is really the core point of TileStache, though it's all certainly table stakes.
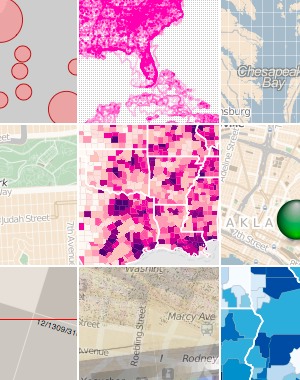
The place where I've found a need for a new project is somewhere in the intersection between synthetic imagery, composites of existing imagery, and delivery of raw vector data to browsers. More and more we're dealing with the expressive possibilities of new web cartography in project like Pretty Maps, and TileStache is a possible approach to data publishing that borrows a lot of the simplicity of TileCache while adding a dose of designed-in extensibility for creating new kinds of maps.
Isotiles
After developing Travel Time Maps with MySociety in 2008, we adapted our bitmap data imagery technique to tiled delivery. The follow-on Mapumental project hypothetically covers the entirety of the UK with dynamic, temporal data.
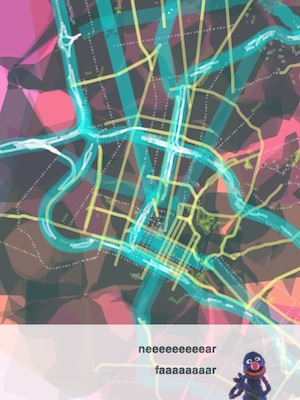
Here's a screenshot from one of the early demos, showing travel times around a city, lit up over the coastline:

It's not animated (check the Channel4 site for a video of Mapumental), but this is one of the constituent map tiles underlying the image:

Each pixel in this tile is a 24-bit value encoded in the red, green, and blue channels, expressing a time and speedily decoded by the Flash application in the browser. This part of the project is driven by a custom Layer class in TileCache, that pulls pre-computed time points (e.g. transit stations) from a database and renders cones around them. Some of the code might be findable in MySociety's source repository.
What's interesting here is the idea of completely synthetic providers, i.e. those not directly based on GDAL sources, Mapnik renderings, or WMS servers. It's something I'm demonstrating in the TileStache Grid provider, an implementation of the UTM grid (U.S. National Grid and Military Grid Reference System) for overlay onto other spherical mercator maps.
Composites
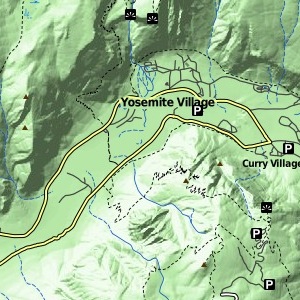
Lars Ahlzen's TopOSM is a longtime rendering project based on OpenStreetMap data and cartography built from constituent pieces of Mapnik. TopOSM combines renderings of streets, hills, and labels to create a beautiful, dimensional result:
Lars builds the final map up from a stack of images, many of which might themselves be expressed as tile layers:
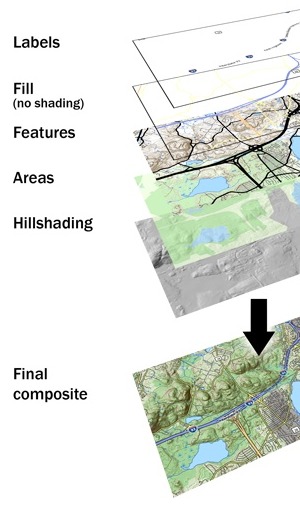
In attempting to build a new Layer class for TileCache that expresses this idea, I found that it seemed to be impossible to access the full configuration of the system from within a given layer. There was no way to create a derived map sandwich, and I knew that Lars's own method was a homebrew of ImageMagick and similar tools. I'm interested in something a bit more systematic that implements something like Photoshop layers for cartography. The current Composite provider in TileStache provides layers, alpha channels, color fills and masks, and I'd like to implement transfer modes (e.g. Photoshop's hard light) if this sample proves to be interesting.
We've delivered this sort of composite cartography to clients in the past, but always through a combination of spit and chewing gum.
GeoJSON Data
Most recently, we've been developing Polymaps, an SVG-based map engine that can show regular image tiles in combination with vector overlays driven by GeoJSON data. Tiles turn out to be just as helpful for publishing and requesting vector data as they are for pixel-based images. We've modified TileCache to support this use in the past, but there are simply too many places where the code assumes pixel-based images for the exercise to be anything but frustrating. TileStache is designed to accommodate data-only tiles, including an example PostGeoJSON provider that converts PostGIS data to GeoJSON.
As the ability of browsers to interpret and display a wider variety of imagery improves, we're going to see this data tile concept become increasingly useful. Why stop at image tiles, when you might want to render roads that can be rolled-over or clicked directly? Why assume dynamic data services, when TMS-style tile URLs (e.g. */12/656/1582.png) can be hosted from simple storage services or plain filesystems?
Anyway.
It's early days, but we're finding that the limitations around in-browser display of layers and data are increasingly down to the display of SVG or Canvas rather than any particular native slowness in Javascript itself, so we're thinking that our still-fairly-intensive experimental demos getting a few kinds words from friends like Nathan, Alyssa, and Jen will calmly scroll into the window of normalcy within the next year or so. We also know that other developers are thinking about some of the same concerns that the motivating goodies above address. For example, Dane tells me that the current bleeding edge of the map-rendering library Mapnik includes basic image compositing, masking, and GeoJSON output right there in the core.
Really what we're looking at is a future filled with work like Brett Camper's amazing 8-Bit Cities, "an attempt to make the city feel foreign yet familiar ... to evoke the same urge for exploration, abstract sense of scale, and perhaps most importantly unbounded excitement."
What are the tools that help make this possible?

Aug 12, 2010 5:30am
census-tools
The U.S. Census publishes an astonishing volume of data, notably with the most recent 2000 count. The demographic data contained in each of the summary files is precise, detailed, and distributed in a difficult-to-understand text format. The documentation for summary file #1 alone (race, age, sex) is a 637 page PDF file, and the actual data is stored in a maze of zip files all alike.
I've poked at these before, but I recently got a bee in my bonnet about making them available in a more useful form so they could be mapped. I talked to Josh Livni (of Land Summary) quite a while back about his plans for a demographic summary site that would store everything in a database in the cloud. Then Amazon made it available as a public dataset. Still I was not satisfied - both approaches to handling the data seemed a bit ocean-boiling in retrospect.
I've been experimenting with something I'm tentatively calling census-tools that seeks to make this data a bit more accessible. I'm motivated by the idea that predictably-structured zip files stored on a web server and accessed with Python's excellent stream-handling libraries might actually be considered quite a good API, so the first tool in the repository proceeds from there. It does a very simple thing: given an optional U.S. state, a geographic summary level (e.g. census tract or county), and a type of data, it unzips those remote files into memory and converts them to a tab-separated values file.
Here's an example:
python census2text.py ––verbose ––wide ––state=Hawaii ––geography=county ––table=P18 ––output=hawaii-households.txt
It outputs a chatty text file of household data for every county in Hawaii into a file called hawaii-households.txt. It takes about a minute to churn through a 2.8MB zip file and output the results. Omitting the state name gets you every county in the U.S. in about 20 minutes:
python census2text.py ––verbose ––wide ––geography=county ––table=P18 ––output=national-households.txt
I tested with Hawaii because it's small, and immediately discovered the strangely underpopulated Kalawao County:
The county is coextensive with the Kalaupapa National Historical Park, and encompasses the Kalaupapa Settlement where the Kingdom of Hawai'i, the territory, and the state once exiled persons suffering from leprosy (Hansen's disease) beginning in the 1860s. The quarantine policy was lifted in 1969, after the disease became treatable on an outpatient basis and could be rendered non-contagious. However, many of the resident patients chose to remain, and the state has promised they can stay there for the rest of their lives. No new patients, or other permanent residents, are admitted. Visitors are only permitted as part of officially sanctioned tours. State law prohibits anyone under the age of 16 from visiting or living there.
Fascinating.
Anyway, this small amount of information can be quite hard to get to. Between the impenetrable formatting of the geographic record files, the bewildering array of different kinds of geographic entities, and the depth of geographic minutiae, it can take quite a bit of head-scratching to extract even the first bits of information from the U.S. Census.
I hope this first tool makes it a little bit less of a hassle. I'd accept whatever patches people choose to offer: support for summary files beyond SF1, additional geograph summary levels, general patches, and more.
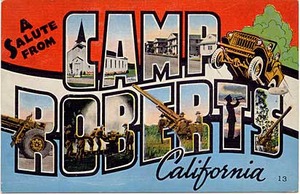
Aug 5, 2010 7:05am
stress conditions
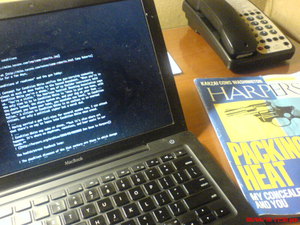
I'm at Camp Roberts again for a few days, working on Walking Papers with friends from STAR-TIDES, FortiusOne, Google, and Gonzo Earth on open source, geographic crisis response technology. Being in a military environment working on responses to high-speed disaster has me thinking about stress and preparedness. Two excellent magazine articles on the subject crossed my path recently, both forming a cohesive view on the privilege of living without stress. Privilege is driving a smooth road and not even knowing it, and access to that road is contested. Some are born on it, some never reach it, some resent its existence, and some can't shake the memory of the ditch alongside.
Packing Heat, "conditions of readiness," and the gun lobby:
Contempt for Condition White unifies the gun-carrying community almost as much as does fealty to the Second Amendment. "When you're in Condition White you're a sheep," one of my Boulder instructors told us. "You're a victim." The American Tactical Shooting Association says the only time to be in Condition White is "when in your own home, with the doors locked, the alarm system on, and your dog at your feet ... the instant you leave your home, you escalate one level, to Condition Yellow." A citizen in Condition White is as useless as an unarmed citizen, not only a political cipher but a moral dud. ... Having carried a gun full-time for several months now, I can attest that there's no way to lapse into Condition White when armed. ... Condition White may make us sheep, but it's also where art happens. It's where we daydream, reminisce, and hear music in our heads. (Dan Baum in Harpers, sorry for the paywall)
Under Pressure, chemistry, and health/stress feedback loops:
The deadliest diseases of the 21st century are those in which damage accumulates steadily over time. (Sapolsky refers to this as the "luxury of slowly falling apart.") Unfortunately, this is precisely the sort of damage that’s exacerbated by emotional stress. ... One of the most tragic aspects of the stress response is the way it gets hardwired at a young age - an early setback can permanently alter the way we deal with future stressors. The biological logic of this system is impeccable: If the world is a rough and scary place, then the brain assumes it should invest more in our stress machinery, which will make us extremely wary and alert. There's also a positive feedback loop at work, so that chronic stress actually makes us more sensitive to the effects of stress. (Jonah Lehrer in Wired)
subscribe to ![]() this site.
|
contact Michal Migurski
this site.
|
contact Michal Migurski