tecznotes
Michal Migurski's notebook, listening post, and soapbox. Subscribe to ![]() this blog.
Check out the rest of my site as well.
this blog.
Check out the rest of my site as well.
Dec 29, 2006 4:26am
oakland crime maps
Update: I've written a followup to this post.
-
This has been a strange year to live in Oakland. The FBI says violent crime is up, but the City doesn't publish statistics in a particularly friendly format. Inspired by Adrian Holovaty's Chicago Crime, I'm in the process of exploring how the new CrimeWatch II application can be bent into a more usable shape.
This post describes the first two steps in extracting information out of CrimeWatch II: downloading known maps, and extracting positions of crime markers from those maps.
Linked text files:
- Example HTTP transcript: oaklandnet-http-transcript-02.txt (19K)
- Map request shell script: map-download.txt (6K)
- Example icon: vandalism.png (0.3K)
- Final icon matching script: scan-image.py (10K)
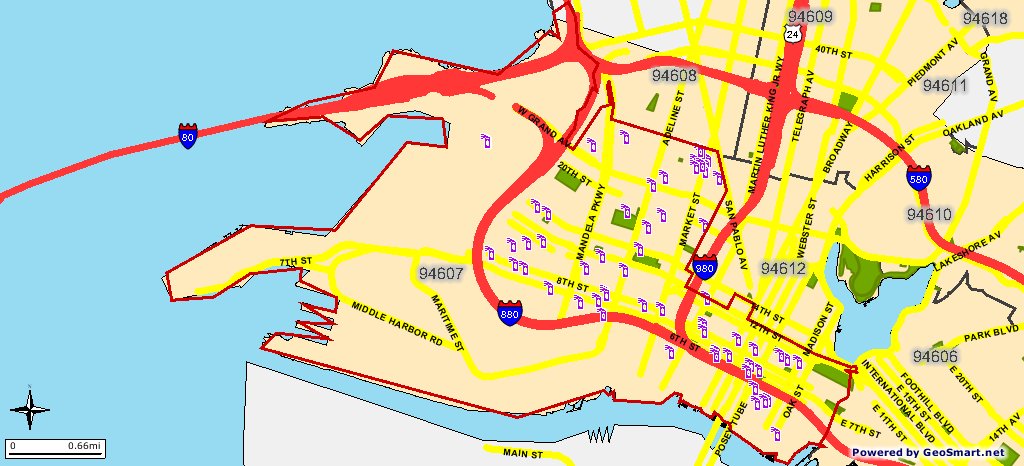
Initially, I had expected this to be a simple screen-scraping project, but as it turns out the available data is published in JPEG form as a series of icons overlaid on simple city maps:

Before attempting to geolocate individual crimes, it would be necessary to pick them out of the map image. Because the CrimeWatch application uses frames, cookies, background-images, and other techniques, it was first necessary to log HTTP traffic and understand what requests and parameters generated each map.
I used the FireFox plug-in LiveHTTPHeaders to pick apart the process of downloading a map. This resulted in an HTTP log such as this one. Getting maps from CrimeWatch is a three-step process: first they require that you accept their terms of use by posting a simple form response, then you choose your search parameters (e.g. zip code, crime type, dates, etc.), and finally you pick through the response HTML for a reference to the map JPEG. I created a basic shell script to walk through these steps. It uses cURL and some basic HTML-parsing Perl to find the map images.
GET /crimewatch/map.asp?mapfunction1=51…
Host: gismaps.oaklandnet.com
User-Agent: Mozilla/5.0 (Macintosh; U; …
Accept: text/xml,application/xml,applic…
Accept-Language: en-us,en;q=0.5
Accept-Encoding: gzip,deflate
Accept-Charset: ISO-8859-1,utf-8;q=0.7,…
Keep-Alive: 300
Connection: keep-alive
Referer: http://gismaps.oaklandnet.com/…
Cookie: OmegaCVCDisclaimer=yes; ASPSESS…

HTTP/1.x 200 OK
Date: Sat, 23 Dec 2006 22:35:36 GMT
Server: Microsoft-IIS/6.0
Content-Length: 1763
Content-Type: text/html
Cache-Control: private
Once the map image has been retrieved, it's necessary to pick through the returned image and identify the crime icons (see the right-hand legend in the screen shot). Because JPEG is a lossy-compression format and many icons occlude one another, it would not sufficient to search for exact pixel matches with the known set of icons. Instead, a more fuzzy, "best fit" method was needed.
I used Python with a combination of PIL and Numeric to extract icons from map images. I created average representations for each type of icon (e.g. "vandalism", PSD and PNG) based on maps with many instances of each.
Visual feature extraction is a two-step problem: quickly find a set of possible locations for icons, then check each in detail to determine if it's a match. The first step needs to eliminate as much background noise as possible for the more time-consuming second step to work quickly. I tried three different approaches before settling on one that seemed to work best.
A first, I tried to simply eliminate background pixels to cut down on the number of possible icon positions. It was easy to find representative colors for land, water, freeways, and parks, and eliminate about 70% of the total map pixels. With approximately 1-megapixel maps, this left about 300K pixels to check for icon matches, a prohibitively large number.
Next, I tried the opposite approach: find representative colors from each icon, and find likely locations based on the presence of those colors, rather than the absence of background colors. This means that I didn't spend a lot of time checking blue "simple assault" parts of the image for obviously-incorrect red "aggravated assault" icons. This was a major time savings, since most icons contain a representative color that appears little on the map. The exception to this rule is "robbery" and "burglary", two crimes that use black & white icons. Searches for these icons take dramatically longer than the others.
Finally, I expanded on the icon matches to better account for partially-occluded icons. When I encounter a possible match that's not strong enough to be included as a complete icon, but is still within about 50% of the threshold, I check the top, bottom, right, and left halves of the icon individually. If any of these result in an above-threshold match, I include them in the final results.
The final Python script takes about 2 minutes to convert the first linked image below into the second. Partially-occluded icons are marked with a light outline, fully-matched icons are marked with dark:
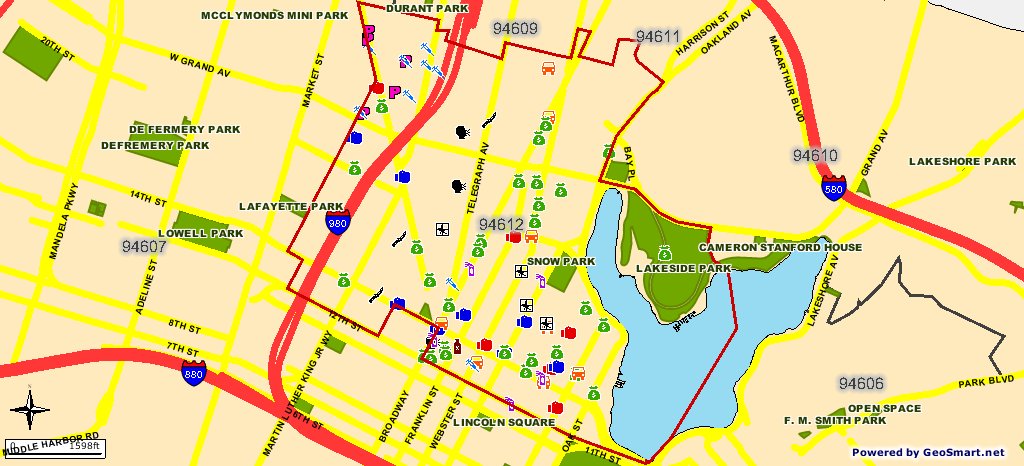
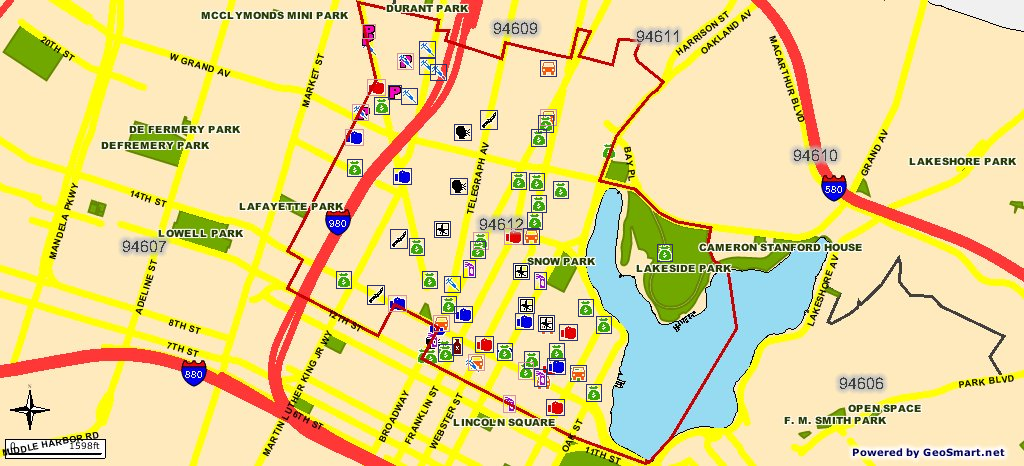
Although there are a few misses, the input image represents an unrealistic worst-case: two weeks' of data covering all possible crimes, with zip code boundaries visible. It is simple to request single-crime maps, with no boundaries, for one-day spans to cut down on the icon overlap.
There are two obvious next steps: use known addresses and intersections to geocode the matched icons (the CrimeWatch application promises only that they are placed at block-level accuracy), and make further HTTP requests for more detail about each crime, especially the time of day at which it was reported.
Also, it appears that the SFPD has recently switched to a crime mapping application developed by the same vendors, Omega Group and MoosePoint (!), so expanding this process to cover San Francisco should be easy.
-
Keep reading the followup to this post.
Dec 23, 2006 8:42pm
new york times, redacted
I'm thrilled that the New York Times decided to publish a redacted editorial in this format:
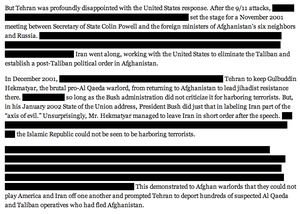
Knowing that information is being edited here is crucially important. See also this flyer design.
Dec 21, 2006 7:39pm
oakland vs. piedmont
Oakland, one mile west of my house:
Two men were killed and four wounded in two shootings that happened a half-hour apart Wednesday night in East and West Oakland, police said. The shootings do not appear to be related, police said Thursday. At 8 p.m. Wednesday a gunman opened fire on a car driving in the 600 block of Apgar Street in West Oakland, killing driver Lord Addo, 21, and wounding his passenger.
Piedmont, one mile east of my house:
For weeks, Piedmont police were stumped by the Beanie Baby bandit. The popular stuffed animals were mysteriously showing up overnight on porches and in the yards of two homes on Rose Avenue. One of the families feared a stalker. Now, police in the tranquil East Bay city think they may have identified a suspect: Gertie, one of the family's cats, which was caught on a surveillance camera carrying the plush toys in its mouth. ... "The cat was caught on tape, but we don't know if it was moving the Beanie Babies from the location where somebody put them," police Capt. John Hunt said Thursday.
Dec 20, 2006 5:23am
time spans in actionscript
This is a quick followup on a previous post about specifying time. I've created a minimal Actionscript 2.0 library that parses and generates time ranges in that form: timespan.tar.gz, 2.5k. Combined with Kevin Lynch's technique for stateful linking in Flash, it should be easily possible to read, use, and update links of the form example.com/#2006-12-19T21:10:00Z/1D0:01:00, for linking to absolute times and timespans in Flash files.
Dec 19, 2006 7:41am
monolake, live
Monolake, Live at Frigid Sydney: part 1, part 2. 60 minutes, minimal techno, very icy.
Dec 16, 2006 7:00pm
saturday link dump
Things currently open in my browser, that I want to read eventually, don't have the time for, and won't eject into the wasteland of Del.icio.us:
- New York Times Year In Ideas
- Indri: Language modeling meets inference networks.
- Jakob Verbeek
- Bray-Curtis Algorithm
- PennAspect PLSA
- PostDocs on InfoViz
- InfoViz Evaluation Papers
- Boot chart for Linux
- Dimitre's photos tagged with "spamart"
Same deal, in Preview:
- A Flat World, A Level Playing Field, a Small World After All, or None of the Above?, Review of Thomas L Friedman, The World is Flat, Edward E. Leamer
- Is There Science In Visualization?, associated slides
- Hofmann '99: Probablistic Latent Semantic Analysis
Dec 15, 2006 8:48am
ableton live
Ableton's Live music software has a great time navigation widget. It's a fairly standard interface for viewing slices of a sequenced composition, similar in spirit to Google Finance. They integrate zoom and pan into a single interface element, mapping vertical motion to zoom (up = zoom out, down = zoom in) and horizontal motion to pan left and right. The two don't occur together, so if you start moving horizontally you don't get to zoom until you make a sharp vertical motion. I suspect there's a cut-off at each 45 degree angle.
Anyway, here is a brief video showing how it works:
It's unfortunate that the mouse cursor has to disappear when dragging.
Dec 15, 2006 7:31am
bike messenger race
This old (new to me) video is out of control: Bike Messenger Race, New York City
What the hell is going on there? Seven minutes of P.O.V. stoplight-running and squeeezing between cabs and busses in the busy streets of Manhattan, that's what. Although I lack the cojones to do something like this myself (and suspect that the excitement is being pumped up a bit with a fisheye lens anyway), what a pleasure to watch. It's like the Star Wars trench run but more visceral, because you feel like one of these riders is going to eat it or get doored I.R.L. at any moment. They weave between pedestrians, shimmy out of the way of cross-traffic, and hold on to vehicles for an extra power-up.
The traffic moves are clearly deadly, but having just visited New York I can say that they're better drivers over there for being as aggressive as they are. Here in San Francisco, I get pissed off at drivers or pedestrians for being wishy-washy: go, no-go, hold on, on the phone, on the pot, etc. In New York everyone just goes, so you pretty much always know what to expect and how to behave. Then again, with asshole bikers like the guys in this video, you end up with something approaching this classic video of traffic in India.
Of course this is all academic for me at the moment, because I have a raging pinched nerve in my leg and it's making me an utter basket case. Can hardly sit or walk, and especially can't ride my bike.
Dec 14, 2006 6:59am
specifying time
I've been trying to think of ways to denote points and ranges in time suitable for use in URL's. Notation should also be human-readable, free of URL "problem" characters (e.g. spaces, ampersands), guessable/hackable, and universally equivalent (i.e. no time zones!). One of the possible contexts is for use in Flash, which is aware of only two time zones: local and UTC. It and Javascript also have clumsy and primitive string support, so anything that requires regular expressions or a state machine is out.
Tom and I kicked around a few simple possibilities today:
- Point: 2006-12-01T06:12:01Z.
- Range, point-to-point: 2006-12-01T06:12:01Z/2006-12-02T06:12:01Z, a machine-friendly way to do ranges.
- Range, point-distance: 2006-12-01T06:12:01Z/1D00:00:00, a more human-readable way to do ranges like "one week".
WMS seems to do something similar, with the same RFC3339-derived stamps chosen for Atom. The distance part of the point-distance range syntax is similar to Python's timedelta string representation.
Too limited, or appropriately limited?
Dec 4, 2006 11:19pm
-
5 minutes ago - Kati Kim and her two girls have been found, they are being helicoptered out to a hospital. James Kim went out on foot two days ago and the Search and Rescue team are now tracking him and hope to find him soon.
subscribe to ![]() this site.
|
contact Michal Migurski
this site.
|
contact Michal Migurski