tecznotes
Michal Migurski's notebook, listening post, and soapbox. Subscribe to ![]() this blog.
Check out the rest of my site as well.
this blog.
Check out the rest of my site as well.
Sep 18, 2012 6:35am
a beginners guide to streamed data from Twitter
A few months ago, Shawn Allen and I taught a class on visualizing and mapping data at GAFFTA. We covered everything from client-side Javascript map interaction, basemap design with OpenStreetMap and Mapnik, dynamic in-browser graphics with D3, to ingesting and handling raw open public data. For one set of exercises, we prepared a selection of tweets pulled from the Twitter Streaming API, affectionately known as the fire hose. This data, which I had assumed would just be a throwaway set of raw points to use when demonstrating other concepts, turned out to be a major source of interest all on its own. With Stamen’s annual MTV Twitter project behind us, I thought it’d be worth describing the process we used to get data from Twitter into a form usable in a beginning classroom setting.
This is a brief guide on using the Twitter live streaming API, extracting useful data from it, and converting that data into a spreadsheet-ready text form, all using tools available on Mac OS X by default. There’s also a brief Python tutorial for scrubbing basic data buried in here someplace.
Getting useful data from the Twitter Streaming API
There are a lot of onerous and complicated ways to deal with Twitter’s data, but they’ve thoughtfully published it in a form that’s a breeze to deal with just using command line tools included on Mac OS X. I’m still on 10.6 Snow Leopard myself (10.6.8 4 Lyfe!) but assuming Apple hasn’t done anything horrible with the Lions everything below should work on newer systems.
The first thing you need to do is open up the Terminal app, and get yourself to a command line. We’ll be using a program called cURL to download data from Twitter (more on cURL), starting with a simple sample of all public tweets. With your own Twitter username and password in place of “dhelm:12345”, try this:
curl --user dhelm:12345 \
     https://stream.twitter.com/1.1/statuses/sample.json
You will see a torrent of tweets fly by; type Control-C to stop them. statuses/sample is a random selection of all public updates. To get a specific selection of tweets matching a particular search term or geographic area, we’ll use statuses/filter with a location search:
curl --user dhelm:12345 \
     -X POST -d 'locations=-123.044,36.846,-121.591,38.352' \
     https://stream.twitter.com/1.1/statuses/filter.json \
     > raw-tweets.txt
The “-X POST” option posts search data to Twitter and the “-d 'location=…'” option is the data that gets sent. The numbers “-123.044,36.846,-121.591,38.352” are a bounding box around the SF Bay Area, determined by using getlatlon.com. The part at the end, “> raw-tweets.txt”, takes that flood of data from before and redirects it to a file where you can read it later. cURL will keep reading data until you tell it to stop, again with Control-C. I left mine open on a Sunday evening while making dinner and ended up with almost 20MB of Twitter data from New York and San Francisco.
Now, we’re going to switch to a programming environment called Python to pull useful data out of that file. Type “python” to start it, and you should see something like this:
Python 2.6.1 (r261:67515, Jun 24 2010, 21:47:49)
[GCC 4.2.1 (Apple Inc. build 5646)] on darwin
>>>
The “>>>” means Python is ready for you to type commands. First, we’ll read the file of data and convert it to a list of tweet data. Type these lines, taking care to include the indentation:
import json
tweets = []

for line in open('raw-tweets.txt'):
  try:
    tweets.append(json.loads(line))
  except:
    pass
That will read each line of the file and attempt to parse the tweet data using json.loads(), a function that converts raw JSON messages into objects. The try/except part makes sure that it doesn’t blow up in your face when you hit an incomplete tweet at the end of the file.
Find out how many you’ve collected, by printing the length (len) of the tweets list:
print len(tweets)
Now look at a single tweet:
tweet = tweets[0]
print tweet
It’ll look something like this map of a tweet published by Raffi Krikorian:
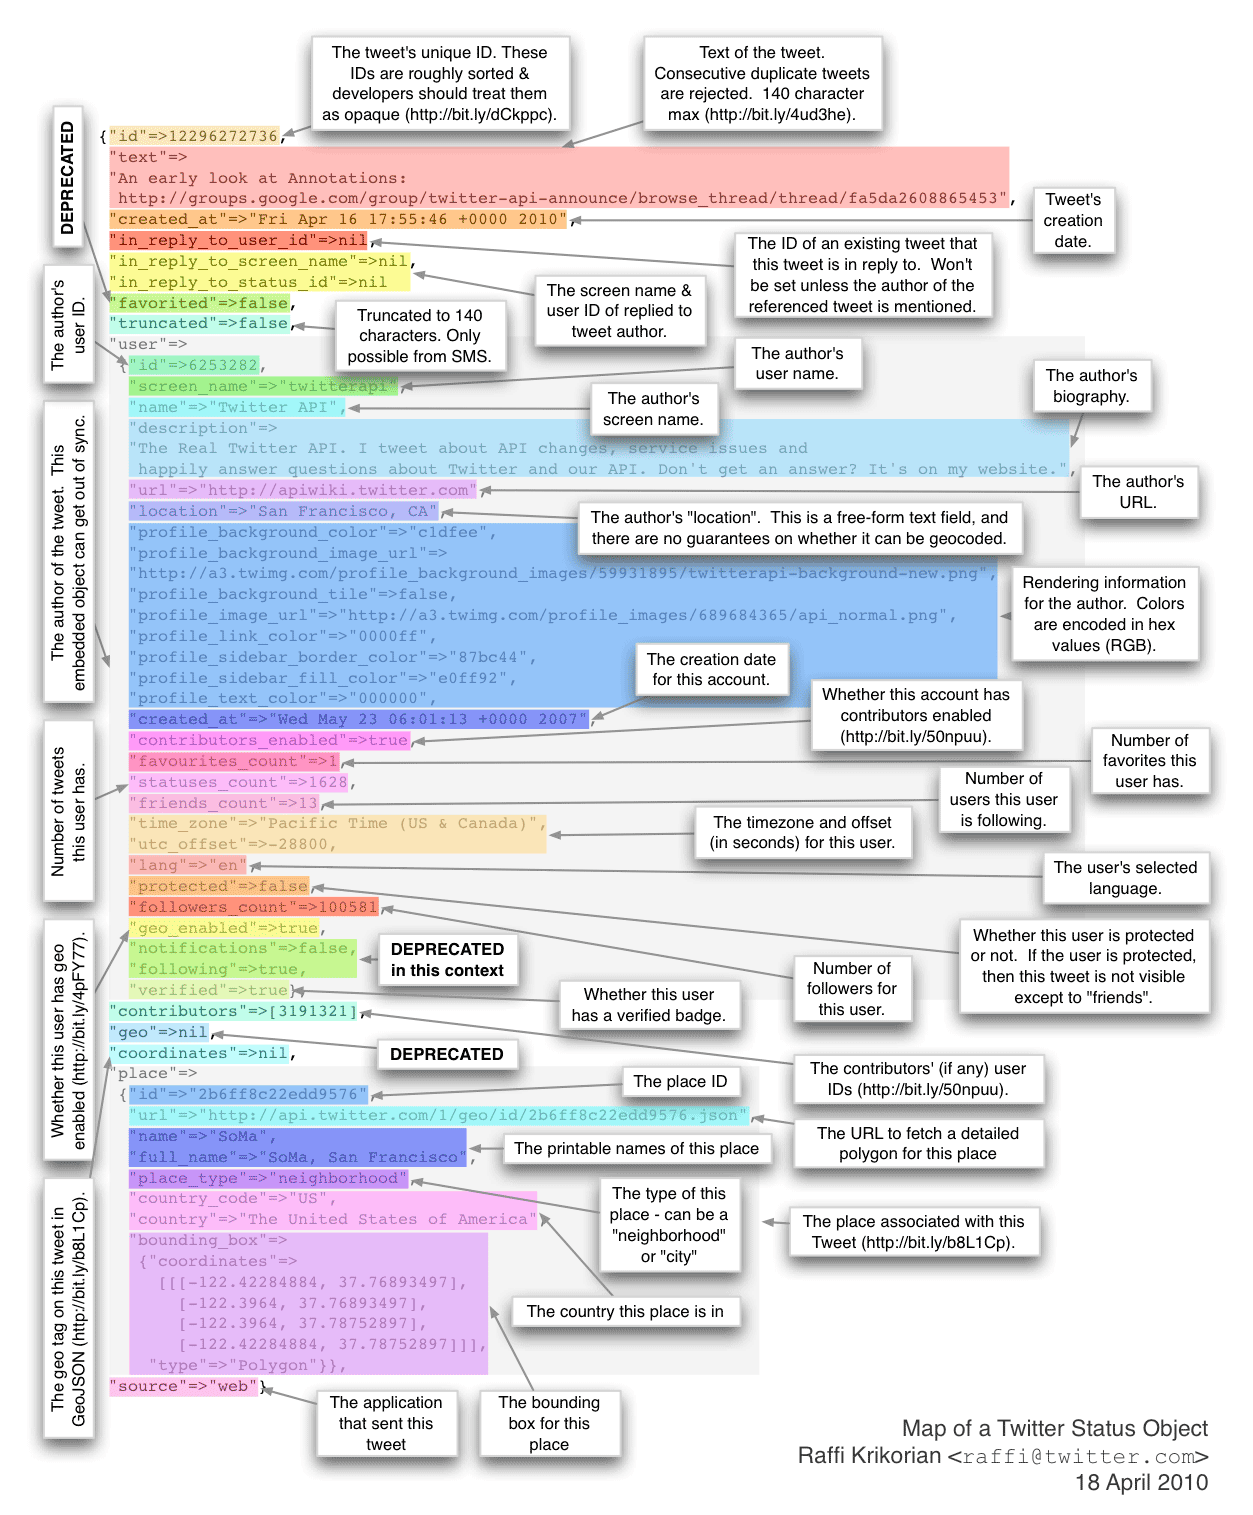
That might be a bit much, so just look at the top-level keys in the tweet object:
print tweet.keys()
You’ll see a list of keys: user, favorited, contributors, entities, text, created_at, truncated, retweeted, in_reply_to_status_id, coordinates, id, source, in_reply_to_status_id_str, in_reply_to_screen_name, id_str, place, retweet_count, geo, in_reply_to_user_id_str, and in_reply_to_user_id.
The id, text and time tweeted (“created_at”) are interesting. We’ll use “id_str” instead of “id” because Twitter’s numbers are so large that it’s generally more reliable to use string version than the numeric version. We can make a list of ID’s by looping over every tweet, like this:
ids = []
for tweet in tweets:
  ids.append(tweet['id_str'])
Since all we’re doing in this tutorial is looping over lists, it’s easier and faster to learn a feature of the Python language called list comprehensions. Carl Groner has an excellent explanation, as does Oliver Fromme. The short version is that these three lines are equivalent to three for-loops like the one above:
ids = [tweet['id_str'] for tweet in tweets]
texts = [tweet['text'] for tweet in tweets]
times = [tweet['created_at'] for tweet in tweets]
So now we have three lists: unique ID’s, text content (the actual words people wrote), and times for each tweet.
How about user information?
print tweet['user'].keys()
You’ll see another list of keys, with per-user information for each tweet: follow_request_sent, profile_use_background_image, geo_enabled, description, verified, profile_image_url_https, profile_sidebar_fill_color, id, profile_text_color, followers_count, profile_sidebar_border_color, id_str, default_profile_image, listed_count, utc_offset, statuses_count, profile_background_color, friends_count, location, profile_link_color, profile_image_url, notifications, profile_background_image_url_https, profile_background_image_url, name, lang, following, profile_background_tile, favourites_count, screen_name, url, created_at, contributors_enabled, time_zone, protected, default_profile, and is_translator. Twitter’s API saves you from having to look up extra information about each tweet by including it right there in every message. Although a tweet is only 140 characters, there can be as much as 4KB of data like this associated with each one.
We’ll just grab everyone’s name and screen name and leave the rest alone:
screen_names = [tweet['user']['screen_name'] for tweet in tweets]
names = [tweet['user']['name'] for tweet in tweets]
Looking for links, users, hashtags and places
When you tweet the “@” or “#” symbols or include links to web pages, these are interesting extra pieces of information. Twitter actually finds them for you and tells you exactly where in a message they are, so you don’t have to do it yourself. Look at the contents of a tweet’s entities object:
print tweet['entities']
You will see three lists: {'user_mentions': [], 'hashtags': [], 'urls': []}. For the tweet I chose, these are all empty. We’ll need to hunt through the full list of tweets to find one with a user mention, print it out and stop (“break”) when we’re done:
for tweet in tweets:
  if tweet['entities']['user_mentions']:
    print tweet['entities']['user_mentions']
    break
You may see something like this:
[
  {
    'id': 61826138,
    'id_str': '61826138',
    'indices': [0, 10],
    'screen_name': 'sabcab123',
    'name': 'Sabreena Cabrera'
  },
  {
    'id': 270743157,
    'id_str': '270743157',
    'indices': [11, 22],
    'screen_name': 'SimplyCela',
    'name': '(:'
  }
]
The two-element indices array says where that user mention begins and ends in the tweet; the rest of it is information about the mentioned user. In this case, I found a tweet with two users mentioned. Try doing the same thing for hashtags and urls. Links include Twitter’s shortened t.co link, the original fully-expanded address, and text that a client can display:
[
  {
    'indices': [39, 59],
    'url': 'http://t.co/XEvdU0cW',
    'expanded_url': 'http://instagr.am/p/PqMhTZtpw-/',
    'display_url': 'instagr.am/p/PqMhTZtpw-/'
  }
]
For every tweet in the list, we’ll pull out the first and second user mention, hashtag and link. Since many tweets may not have these and Python will complain if asked to retrieve and item in a list that doesn’t exist, we can use an if/else pattern in Python that checks a value before attempting to use it: thing if test else other_thing:
mentions1 = [(T['entities']['user_mentions'][0]['screen_name'] if len(T['entities']['user_mentions']) >= 1 else None) for T in tweets]
mentions2 = [(T['entities']['user_mentions'][1]['screen_name'] if len(T['entities']['user_mentions']) >= 2 else None) for T in tweets]
hashtags1 = [(T['entities']['hashtags'][0]['text'] if len(T['entities']['hashtags']) >= 1 else None) for T in tweets]
hashtags2 = [(T['entities']['hashtags'][1]['text'] if len(T['entities']['hashtags']) >= 2 else None) for T in tweets]
urls1 = [(T['entities']['urls'][0]['expanded_url'] if len(T['entities']['urls']) >= 1 else None) for T in tweets]
urls2 = [(T['entities']['urls'][1]['expanded_url'] if len(T['entities']['urls']) >= 2 else None) for T in tweets]
At the beginning of this exercise, we used a geographic bounding box to search for tweets—can we get the geographic location of each one back? We’ll start with just a point location:
print tweet['geo']
Which gives us something like {'type': 'Point', 'coordinates': [40.852, -73.897]}. So, we’ll pull all the latitudes and longitudes out of our tweets into two separate lists:
lats = [(T['geo']['coordinates'][0] if T['geo'] else None) for T in tweets]
lons = [(T['geo']['coordinates'][1] if T['geo'] else None) for T in tweets]
Twitter also says a little about the place where a tweet was sent, in the place object:
print tweet['place'].keys()
The keys on each place include country_code, url, country, place_type, bounding_box, full_name, attributes, id, and name. We’ve already got geographic points above, so we’ll just make a note of the place name and type:
place_names = [(T['place']['full_name'] if T['place'] else None) for T in tweets]
place_types = [(T['place']['place_type'] if T['place'] else None) for T in tweets]
Outputting to CSV
We’ve collected fifteen separate lists of tiny pieces of information about each tweet: ids, texts, times, screen_names, names, mentions1, mentions2, hashtags1, hashtags2, urls1, urls2, lats, lons, place_names and place_types. They’re a mix of numbers and strings and we want to output them someplace useful, perhaps a CSV file full of data that we can open as a spreadsheet or insert into a database.
Python makes it easy to write files. Start by opening one and printing a line of column headers:
out = open('/tmp/tweets.csv', 'w')
print >> out, 'id,created,text,screen name,name,mention 1,mention 2,hashtag 1,hashtag 2,url 1,url 2,lat,lon,place name,place type'
Next, we’ll let the built-in csv.writer class do the work of formatting each tweet into a valid line of data. First, we’ll merge each of our fifteen lists into a single list using the indispensable zip function. Then, we’ll iterate over each one taking care to encode our text, which may contain foreign characters, to UTF-8 along the way:
rows = zip(ids, times, texts, screen_names, names, mentions1, mentions2, hashtags1, hashtags2, urls1, urls2, lats, lons, place_names, place_types)

from csv import writer
csv = writer(out)

for row in rows:
    values = [(value.encode('utf8') if hasattr(value, 'encode') else value) for value in row]
    csv.writerow(values)

out.close()
Boom! All done. You now have a simple file that Numbers, Excel and MySQL can all read full of sample tweets pulled directly from the live, streaming API.
subscribe to ![]() this site.
|
contact Michal Migurski
this site.
|
contact Michal Migurski
Comments (1)
Thanks!
Posted by dirkmjk on Saturday, November 10 2012 4:59pm UTC
Sorry, no new comments on old posts.