tecznotes
Michal Migurski's notebook, listening post, and soapbox. Subscribe to ![]() this blog.
Check out the rest of my site as well.
this blog.
Check out the rest of my site as well.
Oct 17, 2017 5:36pm
planscore: a project to score gerrymandered district plans
Last winter, I first encountered the new work being done in legislative redistricting and wrote about it in a blog post here. Three groups were pushing for changes to the way we draw lines that could put a halt to GIS-accelerated partisan gerrymandering. Now, we’re publicly launching PlanScore, a new project to measure gerrymandering.
In February, Gill v. Whitford, Wisconsin’s gerrymandering case, was on its way to the Supreme Court of the United States with Paul M. Smith arguing on behalf of the plaintiffs. As of this month, the case has been argued and we’re waiting for a decision.
The Efficiency Gap (E.G.), a new measure of partisan bias, was providing a court-friendly measure for partisan effects. Its authors, Nicholas Stephanopoulos and Eric McGhee, developed the measure with cases like Wisconsin in mind. The E.G. has now been argued before its primary audience, Justice Anthony Kennedy.
Former U.S. Attorney General Eric Holder started the National Democratic Redistrict Committee, a national group helping Democrats produce fairer maps in the 2020 redistricting cycle.
I got excited about fixing partisan gerrymandering because it’s a urgently, viscerally unfair, and because all of my skills and experience feel specifically tailored toward working on this problem. My own background is a mix of data visualization and mapping at Stamen, open government data and technology at Code for America, and open source geospatial code and data at Mapzen and now Remix. This weekend at the Metric Geometry And Gerrymandering Group’s workshop in Madison, Wisconsin, I was surrounded by geometers, mathematicians, political scientists, lawyers, and other nerds who each believe their various backgrounds give them the tools to help fix it.

The new project is called PlanScore. To explain how my collaborators and I will use it to attack partisan gerrymandering I want to briefly talk about cars.
Before the mass adoption of the automobile in the 20th century, people walked, took trains, and used horses to move around. Walking was a normal part of urban life. Watch this incredible video of San Francisco in 1906 for a taste of how people moved through cities: early cars, horse-drawn carriages, cable cars, bicycles, and pedestrians mix it up on San Francisco’s largest street. People are fit and sprightly. With the introduction of the automobile, we gained the ability to move longer distances and more weight. Cities were redesigned around cars, crimes like jaywalking were invented, and freeways emerged to carry commuters to more distant suburbs. The early magic of fast-moving cars paved the way for new, unwanted externalities like traffic and pollution.

In response, writers like Jane Jacobs began introducing some of the ideas that we would later call “walkability”: streets are for people and cities should be planned around smaller and slower forms of movement. This would bring back some of the good things that were lost with the ascent of automobiles. For many years, walkability was an emerging idea in urban planning and academic circles but not otherwise well-known. Technology had introduced a new kind of problem. An idea of resistance was forming, but efforts were only beginning to coalesce into an identifiable movement.
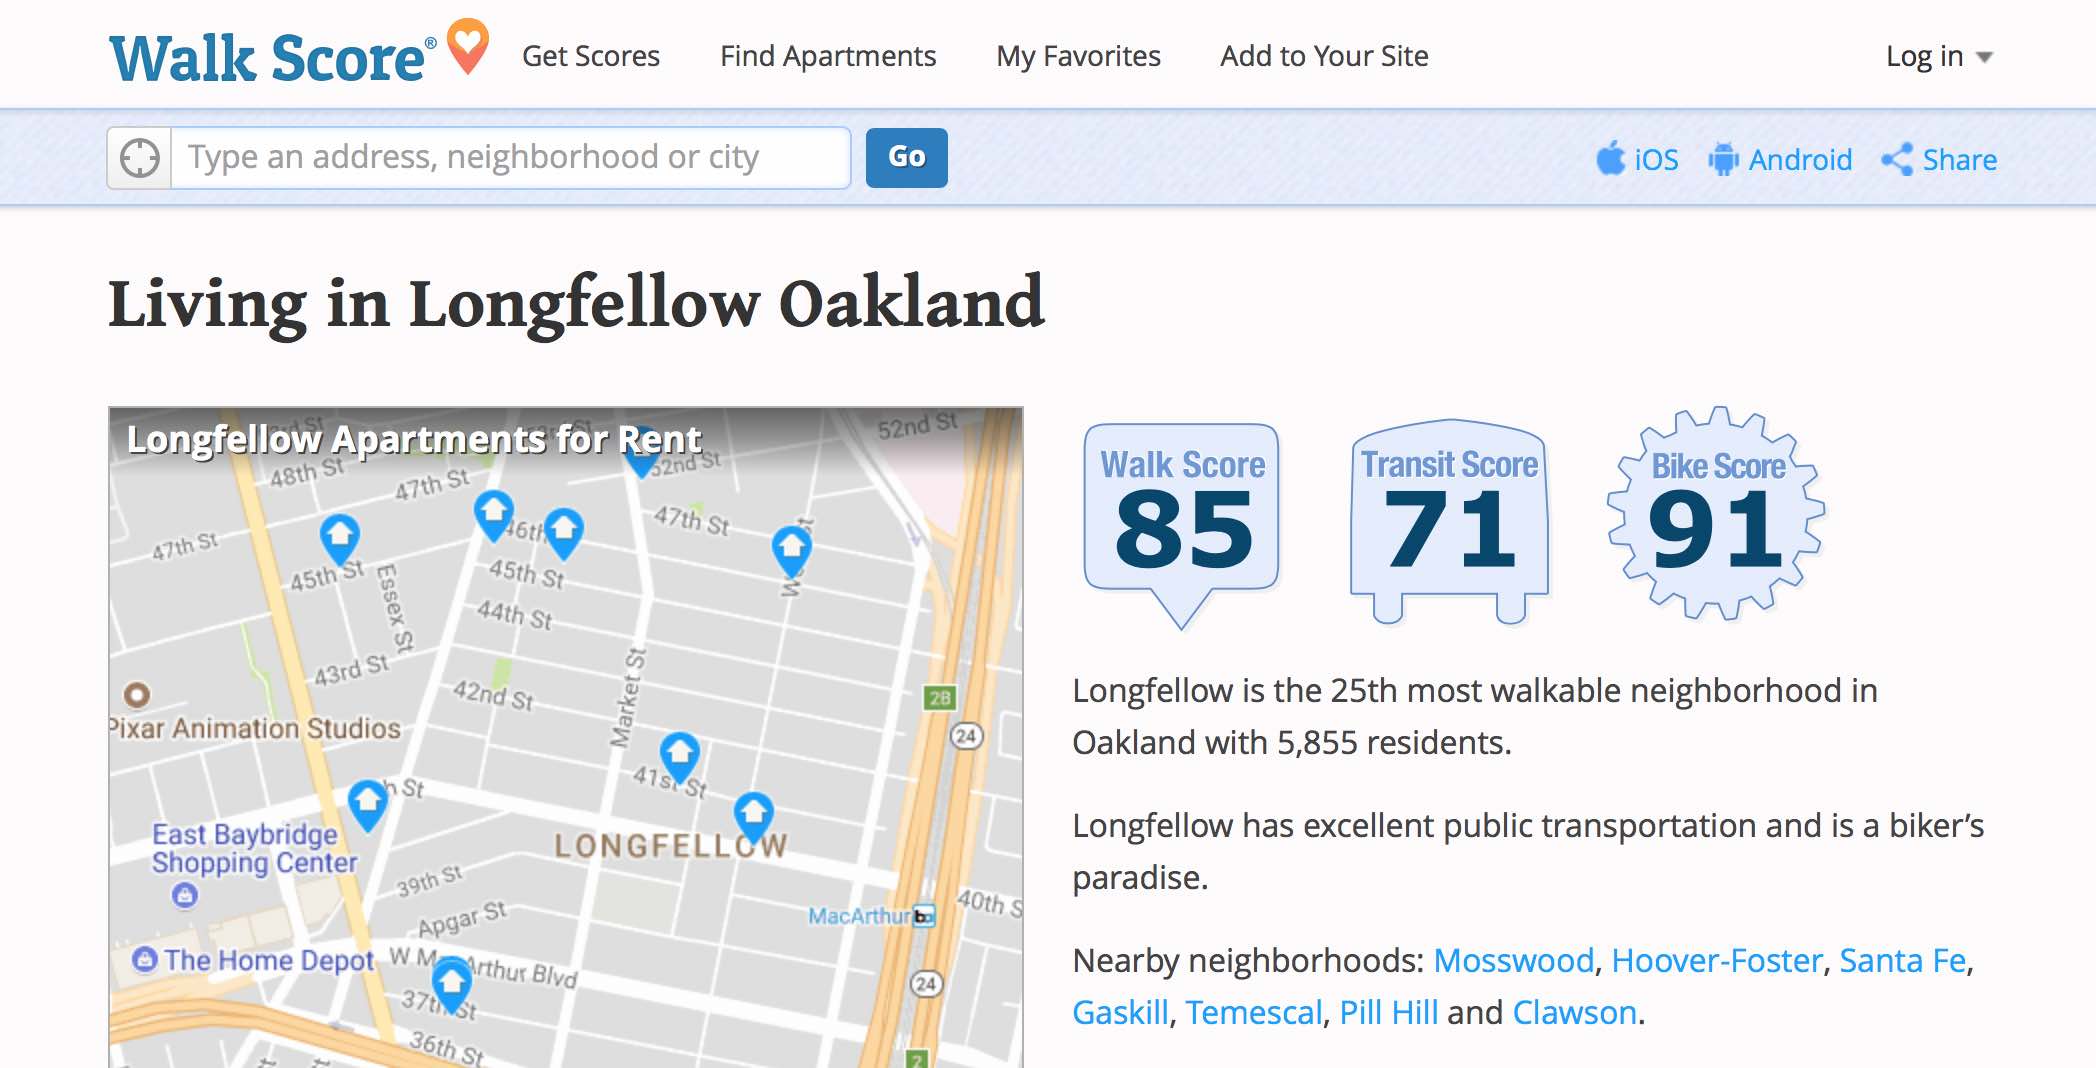
In 2007 Josh Herst founded Walk Score to help people find walkable places to live. The website is significant for two reasons.
First, it publishes scores as easy-to-understand numbers. It’s common to debate the precision of these numbers but they’re an accessible tool for conveying the idea of walkable neighborhoods. Based on measures of local businesses and infrastructure, good scores are now a common feature of real estate and apartment listings. A simple, portable number is an important handle for making a new idea accessible, and I take it as a sign of success that real estate agents and other non-political actors can now consider walkability in their work.
Second, Walk Score publishes scores for everywhere in the United States. It’s built on a mountain of both public and proprietary data. Scores are assembled from business listings, street networks, Census demographics, and USGS physical features. Walk Score accepted the challenge of producing a nationwide number based on complete data, something previously done by planners or researchers in limited local form.
So, we saw the technical advancement of gasoline-powered engines and an explosion of cars and car-oriented city planning, followed by an awareness of new problems and disadvantages once the initial shock and excitement had worn off.
In legislative redistricting, we’re living in a post-RedMap world. In 2010, the Republican party targeted low-level state legislative races with strategic funding injections in order to take control of state houses and subsequently the redistricting process in numerous states. They took full advantage of new technologies in GIS, mapping, and large-scale demographic data. We now see an unfair national map skewed in favor of various relatively-unpopular interests, and we’re seeing evidence that the skew allows even more extreme views to gain power.
There was a huge Republican wave election in 2010, and that is an important piece of this. But the other important piece of RedMap is what they did to lock in those lines the following year. And it's the mapping efforts that were made and the precise strategies that were launched in 2011 to sustain those gains, even in Democratic years, which is what makes RedMap so effective and successful … it gives them, essentially, a veto-proof run of the entire re-districting in the state. (NPR)
PlanScore is doing two things to address partisan gerrymandering.
We are creating score pages for district plans to provide instant, real-time analysis of a plan’s fairness. Each district plan will be evaluated for its population, demographic, partisan, and geometric character in a single place, with backing methodology and data provided so you can understand the number. We’ll publish historical scores back to the 1970s for context, current scores of proposed plans for voters and journalists, and dynamic scores of new plans for legislative staff who are designing tomorrow’s plans.
We are also assembling a collection of underlying electoral data from sources like Open Elections, elections-geodata, and other parallel efforts. Our goal is to provide valid scores for new plans in any state. As we await the outcomes of gerrymandering challenges in Wisconsin and North Carolina, voters and legislative staff in other states are wondering how to apply new ideas to their own plans. In 2020, everyone will have to redraw their maps. PlanScore will be a one-stop shop for district plan analysis.
The team behind PlanScore is uniquely positioned to do this well. Ruth Greenwood is a senior litigator on both major partisan gerrymandering cases, Gill v. Whitford in Wisconsin and LWVNC v. Rucho in North Carolina. Eric McGhee and Nicholas Stephanopoulos co-invented the efficiency gap. Simon Jackman is an expert witness in partisan gerrymandering cases and has collected and analyzed 40 years of relevant data. Our friends at GreenInfo Network will bring their years of expertise in mapping for the public interest to support the work. We’re currently doing two things: writing code in the PlanScore Github repository and raising money for the project for a launch before the decision in Whitford comes down in early 2018! Find us on Twitter @PlanScore for project updates.
subscribe to ![]() this site.
|
contact Michal Migurski
this site.
|
contact Michal Migurski