tecznotes
Michal Migurski's notebook, listening post, and soapbox. Subscribe to ![]() this blog.
Check out the rest of my site as well.
this blog.
Check out the rest of my site as well.
Feb 20, 2017 10:30pm
things I’ve recently learned about legislative redistricting
Interesting things are afoot in legislative redistricting! Over the past ten years, Republicans have enacted partisan gerrymanders in a number of state houses in order to establish and maintain control of U.S. politics despite their unpopular policies. I’ve been learning what I can about redistricting and I’m curious if there’s something useful I could offer as a geospatial open data person.
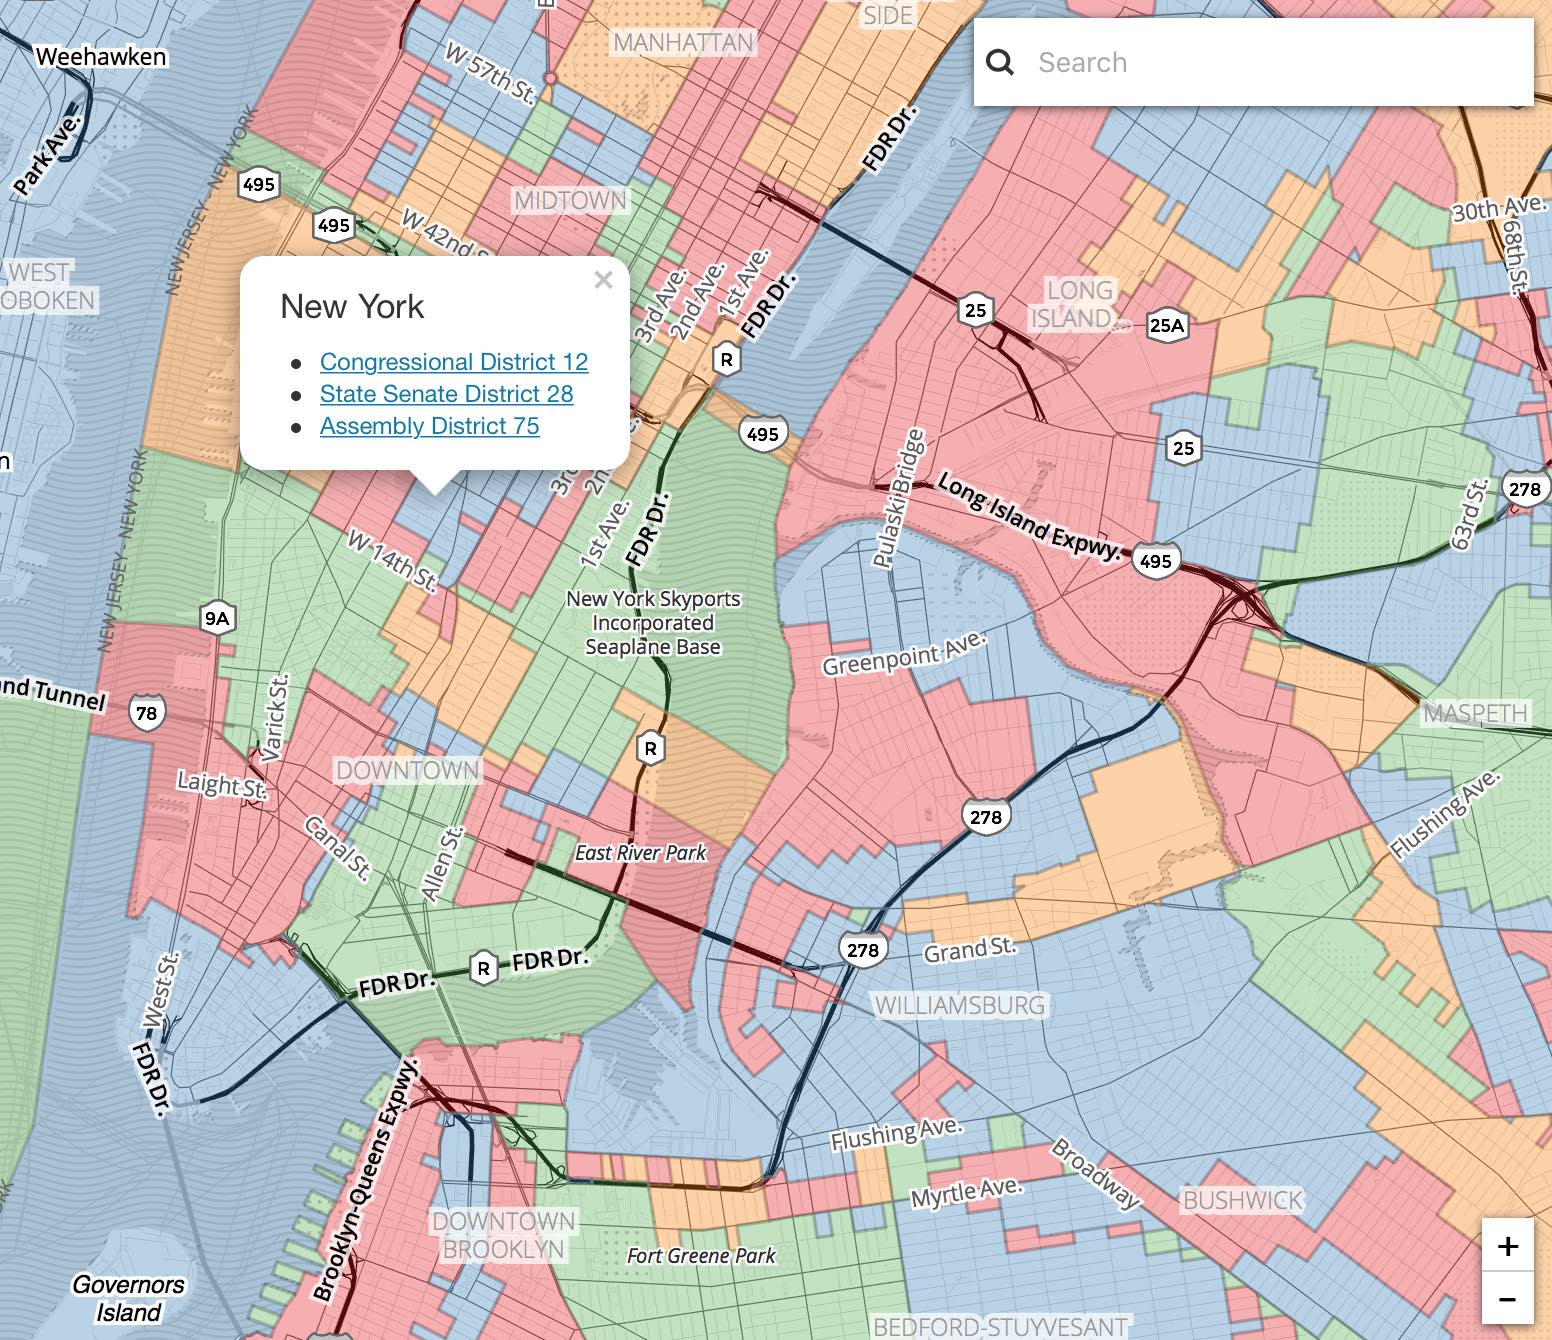
This post is a summary of things I’ve been learning. If any of this is wrong or incomplete, please say so in the comments below. Also, here’s an interactive map of the three overlapping districts you’re probably in right now:
Three exciting things are happening now.
First, Wisconsin is in court trying to defend its legislative plan, and not doing well. It’s a rare case of a district plan being challenged on explicitly partisan grounds; in the past we’ve seen racial and other measures used in laws like the Voting Rights Act, but partisan outcomes have not typically been considered grounds for action. It might be headed to the Supreme Court.
Second, a new measure of partisan gerrymandering, the Efficiency Gap, is providing a court-friendly measure for partisan effects. Defined by two scholars, Nicholas Stephanopoulos and Eric McGhee, the measure defines two kinds of wasted votes: “lost votes” cast in favor of a defeated candidate, and “surplus votes” cast in favor of a winning candidate that weren’t actually necessary for the candidate’s victory. Stephanopoulos sums it up as “the difference between the parties’ respective wasted votes in an election, divided by the total number of votes cast.”
Wisconsin happens to be one of the biggest bullies on this particular block:
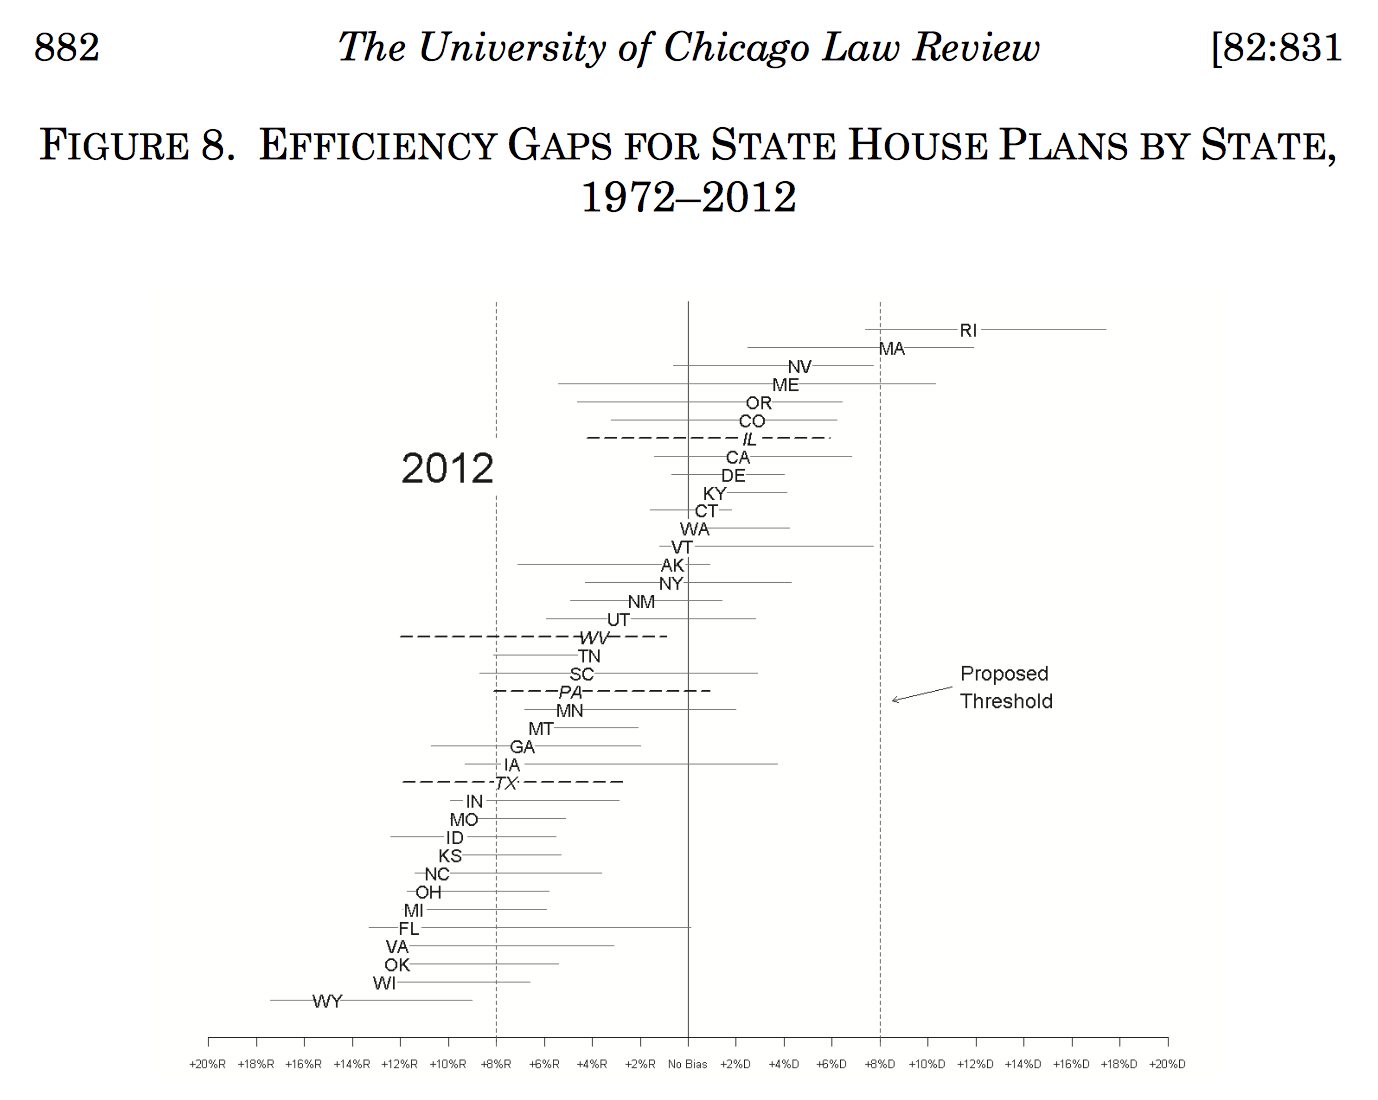
This New Republic article provides a friendly explanation.
Third, former U.S. Attorney General Eric Holder has created the National Democratic Redistricting Committee (NDRC), a “targeted, state-by-state strategy that ensures Democrats can fight back and produce fairer maps in the 2021 redistricting process.” Right now, I’m hearing that NDRC is in early fundraising mode.
So that’s a lot.
I sent some fan mail to Eric McGhee and he graciously helped me understand a bunch of the basic concepts over coffee.
One thing I learned is the significance and use of political geography. As Marco Rogers has pointed out, liberals and democrats clump together in urban areas: “Look at the electoral maps. Drill into the states. What we see is singular blue counties, clustered around cities, in an endless sea of red.” At Code for America, we worked with a number of cities that fell into this pattern, and frequently they were looking to CfA for help dealing with blue town vs. red county issues.
Jowei Chen, associate professor of political science in Michigan, has an extensive bibliography of writing about legislative districts. In his 2013 paper Unintentional Gerrymandering, Chen demonstrates how a sampling of possible redistricting proposals can maintain partisan bias:
In contemporary Florida and several other urbanized states, voters are arranged in geographic space in such a way that traditional districting principles of contiguity and compactness will generate substantial electoral bias in favor of the Republican Party.
Geometry is a red herring. Over the years I’ve encountered a few geometry optimizations for proposed districts, including this one from Brian Olson, written up in the Washington Post:
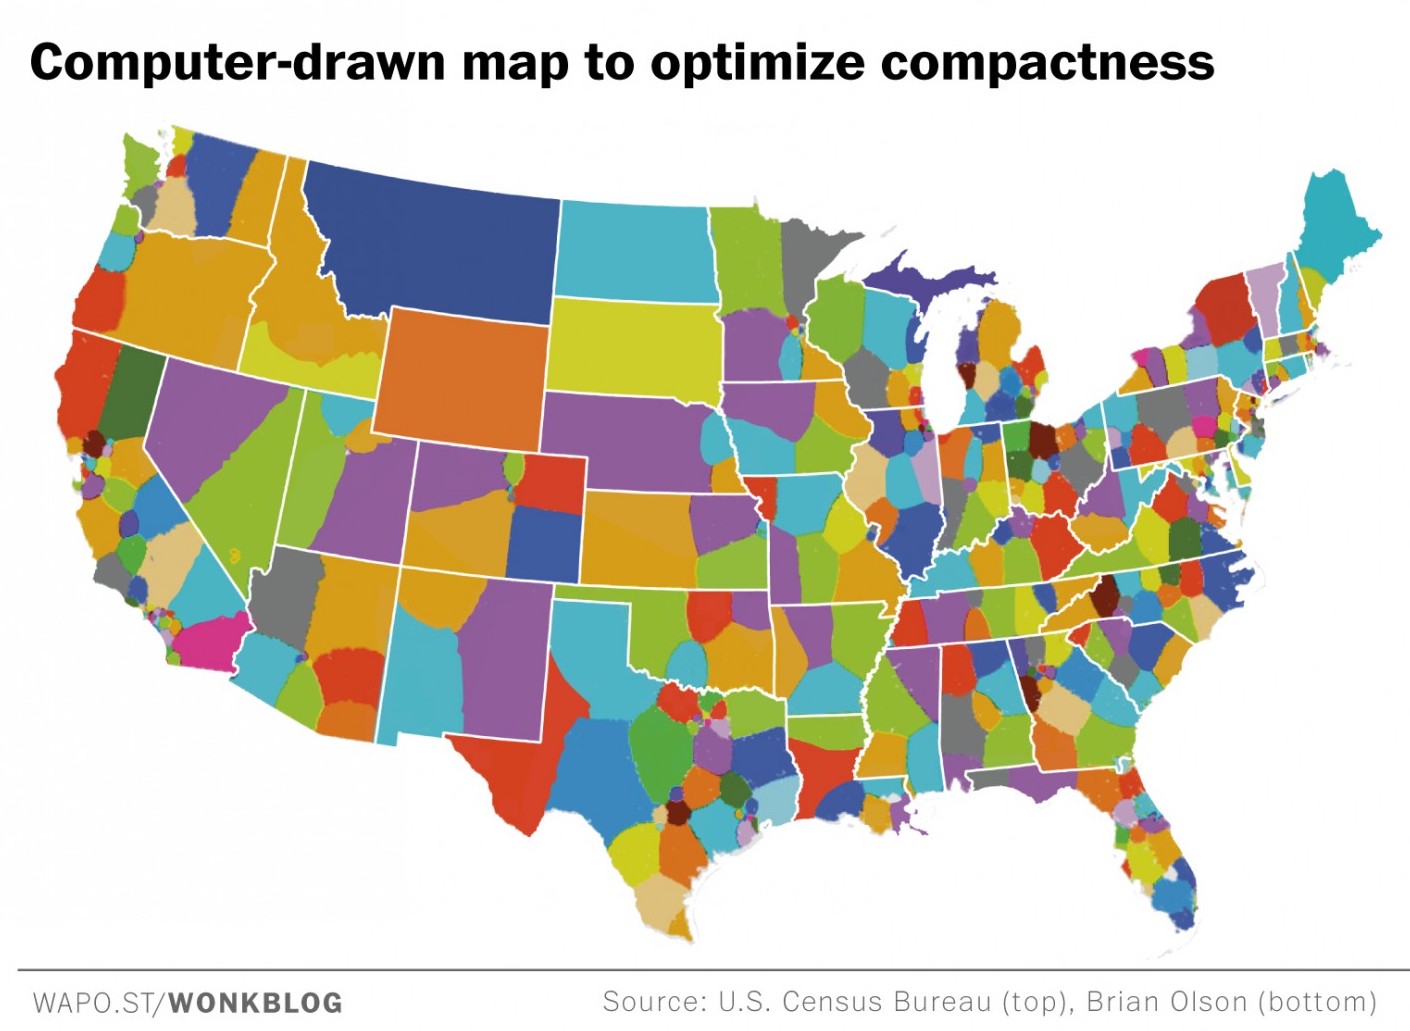
Olson’s proposed district plans
While compactness is desirable in a district, Olson’s method prioritizes visual aesthetics above political geography, and he notes some of the factors he ignores on his site, such as travel time: “it might be the right kind of thing to measure, but it would take too long.” Olson’s method selects aesthetically pleasing shapes that are fast to calculate on his home computer. I think that’s a terrible basis for a redistricting plan, but the goofy shapes that exist in many current plans are a popular butt of jokes:
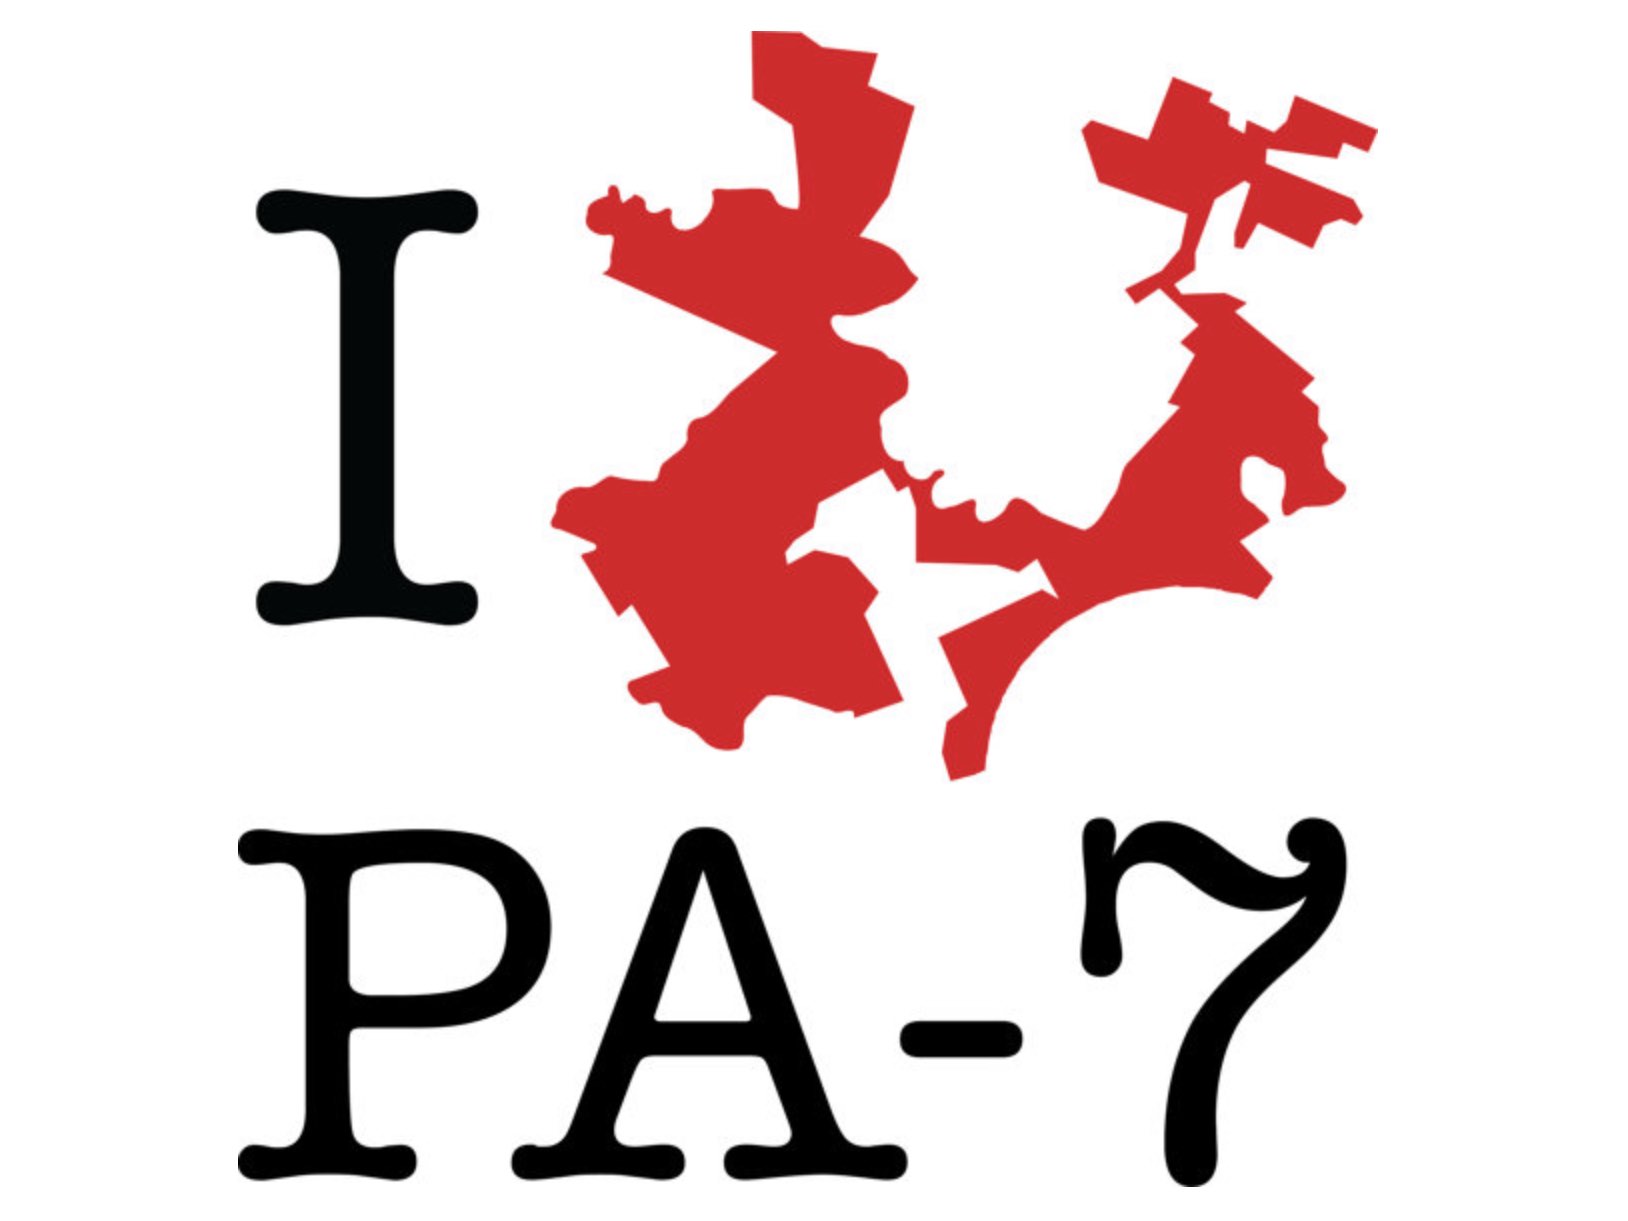
Gerrymandering T-Shirts by BorderlineStyle
Chen particularly calls out how cartographic concerns can be a dead-end:
Our simulations suggest that reducing the partisan bias observed in such states would require reformers to give up on what Dixon (1968) referred to as the “myth of non-partisan cartography,” focusing not on the intentions of mapmakers, but instead on an empirical standard that assesses whether a districting plan is likely to treat both parties equally (e.g., King et al., 2006; Hirsch, 2009).
However, geography is not insurmountable.
In a later 2015 paper, Cutting Through the Thicket, Chen argues through statistical simulations that legislative outcomes can be predicted for a given redistricting plan, and plots the potential results of many plans to show that a given outcome can be intentionally selected:
A straightforward redistricting algorithm can be used to generate a benchmark against which to contrast a plan that has been called into constitutional question, thus laying bare any partisan ad- vantage that cannot be attributed to legitimate legislative objectives.
Here’s Florida’s controversial 2012 plan shown as a dotted line to the right of 1,000 simulated plans, demonstrating a “clearer sense of how this extreme partisan advantage was created:”
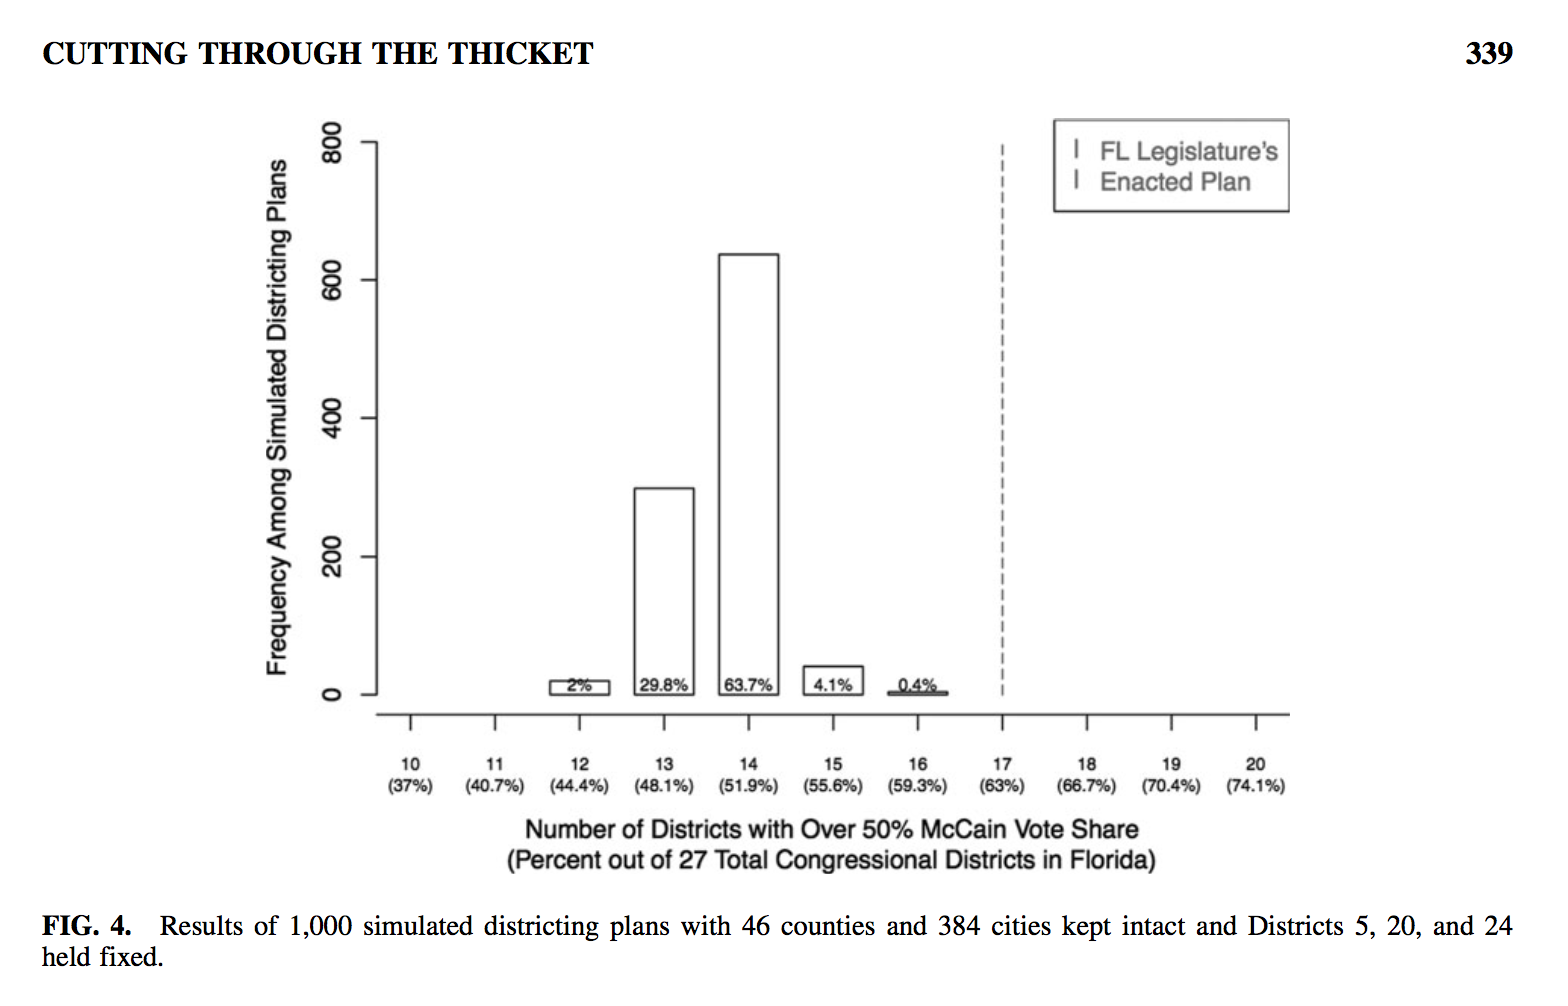
A graph from Chen’s 2015 paper showing simulated partisan outcomes for Florida district plans
Chen concludes that the position of the dotted line relative to the modal outcomes shows partisan intent, if you agree that such an outcome is unlikely to be random.
In 2010, Republicans systematically generated skewed partisan outcomes in numerous state houses, as documented in this NPR interview with the author of Ratf**ked:
There was a huge Republican wave election in 2010, and that is an important piece of this. But the other important piece of Redmap is what they did to lock in those lines the following year. And it's the mapping efforts that were made and the precise strategies that were launched in 2011 to sustain those gains, even in Democratic years, which is what makes RedMap so effective and successful.
“RedMap” was a GOP program led by Republican strategist Chris Jankowski to turn the map red by targeting state legislative races:
The idea was that you could take a state like Ohio, for example. In 2008, the Democrats held a majority in the statehouse of 53-46. What RedMap does is they identify and target six specific statehouse seats. They spend $1 million on these races, which is an unheard of amount of money coming into a statehouse race. Republicans win five of these. They take control of the Statehouse in Ohio - also, the state Senate that year. And it gives them, essentially, a veto-proof run of the entire re-districting in the state.
Holder’s NDRC effort is a counter-effort to RedMap. They’re planning electoral, ballot, and legal initiatives to undo the damage of RedMap. Chen’s simulation method could allow a legislature to overcome geographic determinism and decide on an outcome that better represents the distribution of voters. Chen again:
We do not envision that a plaintiff would use our approach in isolation. On the contrary, it would be most effective in combination with evidence of partisan asymmetry and perhaps more traditional evidence including direct testimony about intent and critiques of individual districts. As with Justice Stevens’ description of partisan symmetry, we view it as a “helpful (though certainly not talismanic) tool.”
So, back to the efficiency gap.
McGhee and Stephanopoulos’s measure counts actual votes in real elections. That’s helpful to courts trying to determine whether a given plan is fair, because it does not rely on guessing about possible outcome from public opinion. Chen’s approach provides a statistical expectation for what a normal plan could do, as well as ways to adjust plans based on desired outcomes. Calculating the efficiency gap for a proposed district plan is complicated, because you need to account for cases where simple red/blue data is missing, such as a uncontested races. You have to impute the potential vote in each proposed new district.
To do this, you need precinct-level election data. Jon Schleuss, Joe Fox, and others working with Ben Welsh at the LA Times Data Desk recently created the most detailed election result map ever made for California. In other states, the data is often not available online, and must be specially requested from sometimes-unhelpful officials. Eric McGhee told me that many experts working on redistricting use a dataset maintained by DailyKos, an independent liberal news website.
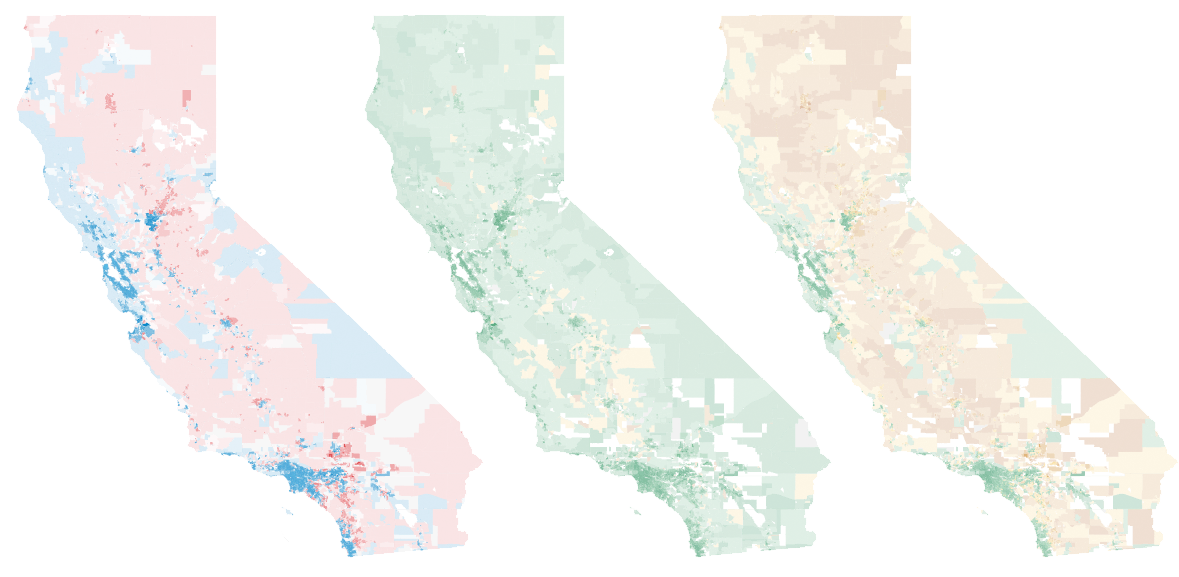
LA Times maps of California’s 2016 election results
There’s a big opportunity here for a carefully-vetted online tool that could calculate measures like the efficiency gap for a variety of districting plans. For my part, I’m getting started understanding the sources and types of data that might help pull district plans in a fairer direction. If you’re curious about your own district, find yourself on this map:
subscribe to ![]() this site.
|
contact Michal Migurski
this site.
|
contact Michal Migurski