tecznotes
Michal Migurski's notebook, listening post, and soapbox. Subscribe to ![]() this blog.
Check out the rest of my site as well.
this blog.
Check out the rest of my site as well.
Dec 14, 2016 6:16am
landsat satellite imagery is easy to use
Helping Bobbie Johnson with the Medium Ghost Boat series about a boat of migrants that’s been missing since 2014, I had need of satellite imagery for context to illustrate a dataset of boat sightings in the Mediterranean Sea off the coast of Libya.
(near Zurawah, Libya)
Fortunately, Landsat 8 public domain U.S. government imagery exists and is easy to consume and use if you’re familiar with the GDAL collection of raster data tools. Last year, Development Seed worked with Astro Digital to create Libra, a simple browser of Landsat imagery over time and space:
At libra.developmentseed.org, you can browse images spatially and sort by cloud cover to pick the best recent Landsat products by clicking a circle and using the dated images in the right side of your browser window. Imagery is not provided as simple JPEG files, and is instead divided into spectral bands described at landsat.usgs.gov. Four of them can be used to generate output that looks like what a person might see looking down on the earth: Blue (2), Green (3), Red (4), and Panchromatic (8). Download and extract these four bands using curl and tar; a bundle of bands will be approximately 760MB:
curl -O https://storage.googleapis.com/earthengine-public/landsat/L8/038/032/LC80380322016233LGN00.tar.bz
tar -xjvf LC80380322016233LGN00.tar.bz LC80380322016233LGN00_B{2,3,4,8}.TIF
Combining these bands is possible with a processing script I’ve adapted from Andy Mason, which corrects each band before merging and pansharpening them into a single RGB output like this:
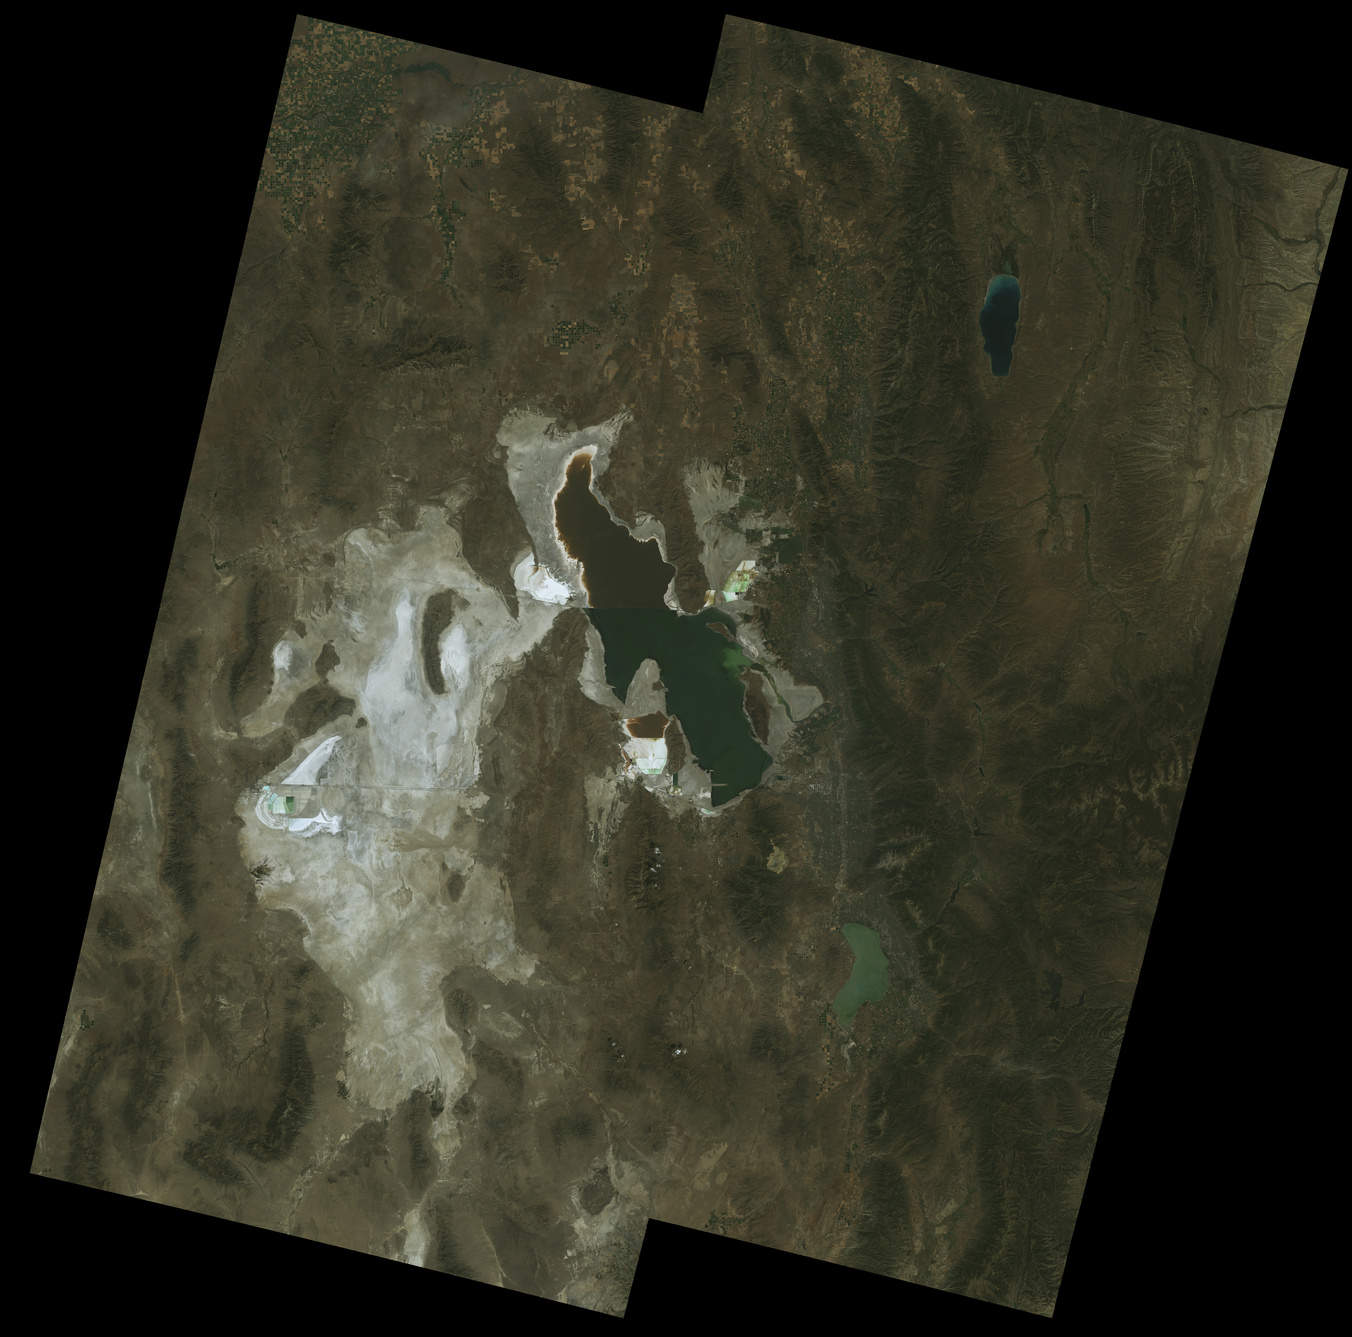
So that’s a good start, but it’s only a corner of Utah’s Great Salt Lake when you might want an image of the whole lake. Each file has large, useless areas of black around the central square. Download four images overlapping the lake and extract the four bands from each:
- LC80380322016233LGN00.tar.bz
- LC80390322016240LGN00.tar.bz
- LC80390312016240LGN00.tar.bz
- LC80380312016233LGN00.tar.bz
Use gdalwarp to convert each of the separate band raster files into a single geographic projection, in this case the common web spherical mercator:
gdalwarp -t_srs EPSG:900913 LC80380322016233LGN00_B2.TIF LC80380322016233LGN00_B2-merc.TIF
gdalwarp -t_srs EPSG:900913 LC80390312016240LGN00_B2.TIF LC80390312016240LGN00_B2-merc.TIF
# repeat for 14 more bands
Then, use gdal_merge to combine them into individual band mosaics that cover the whole area:
gdal_merge.py -o mosaic_B2.TIF -n 0 LC*_B2-merc.TIF
gdal_merge.py -o mosaic_B3.TIF -n 0 LC*_B3-merc.TIF
gdal_merge.py -o mosaic_B4.TIF -n 0 LC*_B4-merc.TIF
gdal_merge.py -o mosaic_B8.TIF -n 0 LC*_B8-merc.TIF
Now, Andy’s processing script can combine a larger area and color-correct all four images together:


