tecznotes
Michal Migurski's notebook, listening post, and soapbox. Subscribe to ![]() this blog.
Check out the rest of my site as well.
this blog.
Check out the rest of my site as well.
Apr 28, 2016 1:17am
guyana trip report
Guyana is about to celebrate its 50th anniversary of independence from Great Britain. It’s not a big country, but it’s two-thirds rain forest and contains the oldest exposed rocks on earth, aged about two billion years. In the inland south of the country, the Wapichan and Macushi Amerindian tribes are asserting their place in the modern world using a combination of political, cultural, and technological means to map their territory. I just spent seven days there observing the material support work of Digital Democracy (Dd), where I’m a board member.
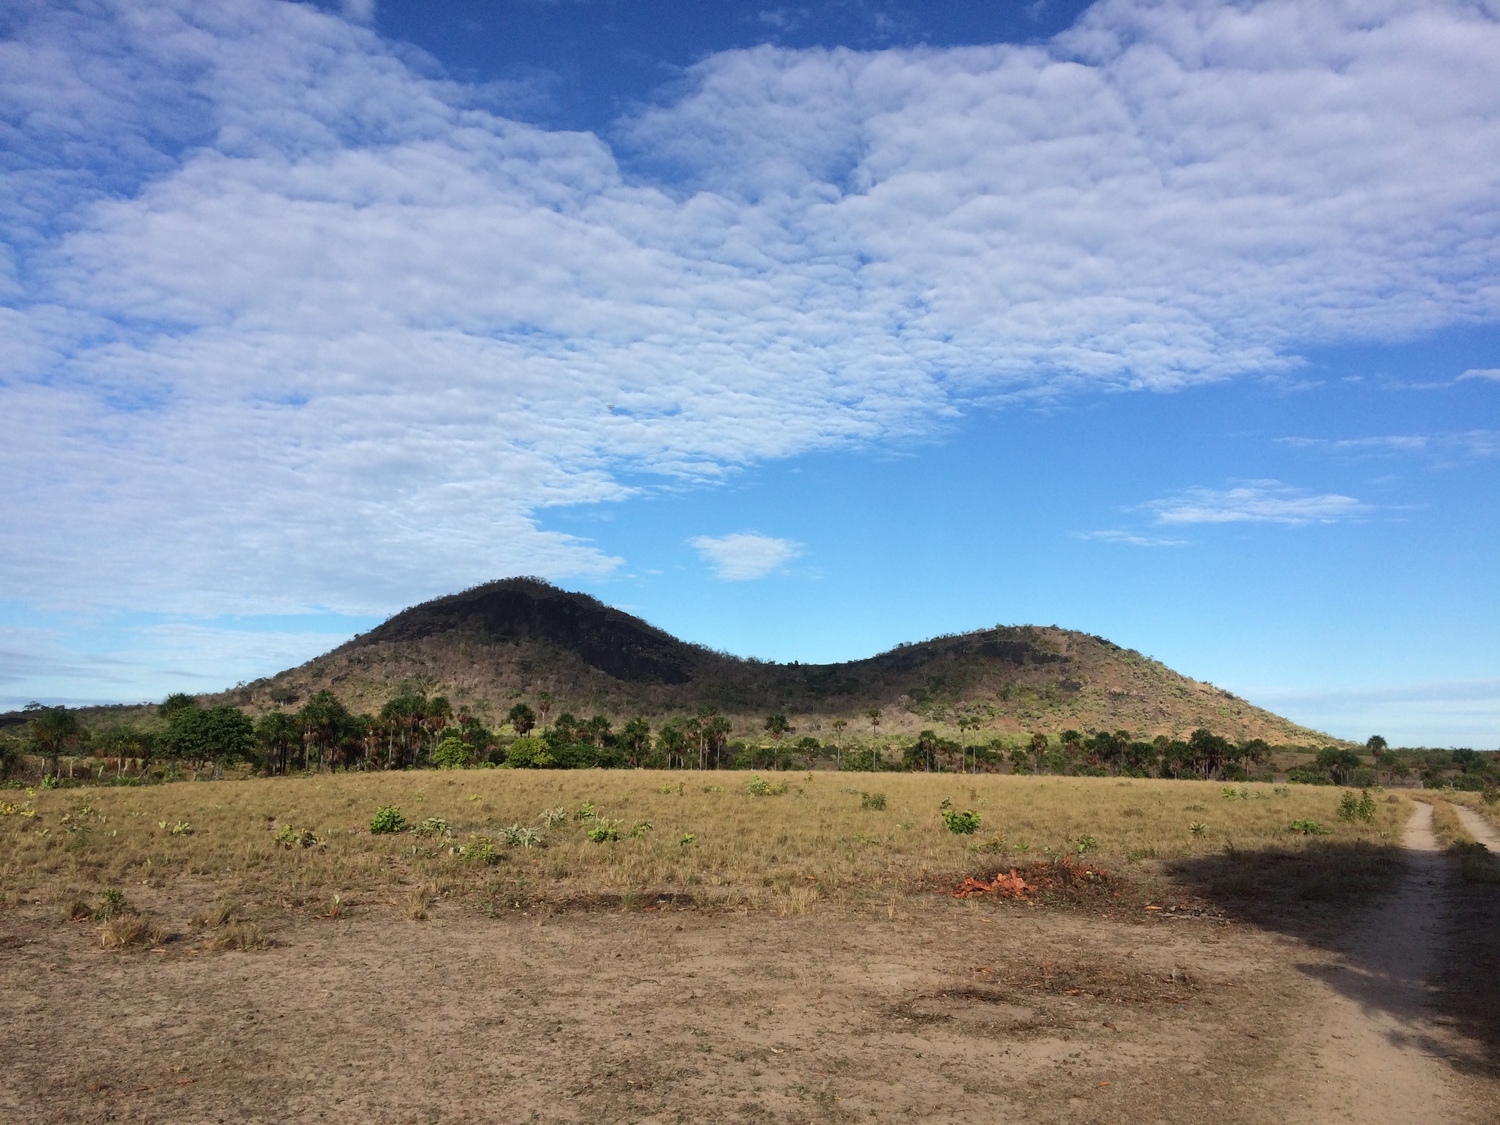
Saddle Mountain is culturally and spiritually significant to the tribe
Dd’s work in Guyana is arranged with the district council of elected leaders, and focuses on a group of environmental monitors covering this enormous 3,000 square mile savannah and the 7,000 square mile forest to the east. The monitors do two kinds of work: they map static sites using OpenStreetMap and Esri tools to compile a replacement for decades-old low-accuracy official maps, and they record evidence for economic/environmental abuses such as cross-border cattle rustling from Brazil to the west and destructive gold mining in the hilly forest rivers to the east. There are just a handful of monitors covering this area: Ezra, Tessa, Gavin, Timothy, Angelbert, and Phillip. They cover the entire Rupununi savannah, and their work typically centers on the northern village of Shulinab where we were guests of Nicholas and Faye Fredericks. Nick is the elected head of the village; he recently accepted the Equator Prize from the UN Development Program to indigenous organizations working on climate change issues.

The guest house where we stayed, newly-built to encourage visitors and possibly tourism
The monitoring work uses drones and phones to collect aerial imagery, and is definitely the more charismatic of the two efforts. Gold mining operations along the rivers in the hills alter the natural habitats of economically-important species, particularly through mercury dumping that can poison un-mined sections of downstream river. Dd’s Gregor MacLennan has been visiting Guyana for the past ten years, and has experimented with a variety of imagery techniques to create a temporal portrait of mining operations along the rivers in the hills. Due to persistent cloud cover, satellite imagery is only intermittently useful, while cheap, low-flying drones can be used in more kinds of weather. The current technology challenge centers on image-stitching; the best results we’ve achieved have come from the expensive Pix4D package, which demands an active internet connection for piracy control purposes. QZ recently wrote an excellent article about the monitoring work.

Dismantled Parrot quadcopter
Border monitoring relies on data collection with OpenDataKit (ODK) and smartphones. The smartphones work well in the savannah, especially now that the monitors have begun using motorcycle-to-USB charging kits to keep batteries powered. ODK is just okay; it’s a clumsy system, likes to have a central server for reporting and collating data, and seems to be designed for a institutional use-case that doesn’t match the need here.

Ron, Ezra, and the monitor team huddling around a smartphone demonstration of new ODK input forms
The static mapping effort is less exciting for outsiders, but more directly useful for the community. ODK has been in use here as well, but we’re working on some new concepts in peer-to-peer OSM editing using distributed logs with James Halliday a.k.a. Substack. James has previously been involved in Max Ogden’s Dat Project, he’s the author of a bunch of popular Node things including Browserify, and p2p architectures are his current jam. This part of the work, dubbed Peermaps, is super promising, and implements a number of concepts borrowed from Git and other distributed data tools. Gregor and James have submitted a talk proposal to State Of The Map U.S. The end goal here is a map of the territory, something the group has been collecting in Esri ArcMap format for the past few years. We saw a wall-sized laminated version of the map, and several area schools have requested print versions for use in classrooms. The data features accurate river lines, and numerous points of interest for cultural and natural features significant to the community. Mapping these features allows the community to support their territorial claims in discussions with the natural government more effectively than previous narrative descriptions.

Tessa, considered the most computer-savvy of the monitors, explained the territory map for me
Probably the most surprising thing about this trip for me was the sophistication of the political organization behind this effort. I had some “white savior complex” worries before I showed up because it’s often hard to tell from secondhand stories who’s really pushing the work, and whether partners are passive or active. In Guyana, the local community is organized into a district council of elected leaders (each called a Toshao) from the seventeen villages, strategy is determined through deliberation, and decisions are made and supported consistently. I spoke with people in Georgetown about the effort and word of Nick and Faye’s energy and creativity here has definitely gotten around. I was honored to be their guest. Dd provides material support, but credit for the recognition of the importance of data collection and the decision to support it through the monitoring program belongs to the community.

Angelbert, Ezra, Timothy, and the monitor team working on the data collection kit; James is on the far right
Ezra, one of the monitors, said at one point that “photos justify our land.” This phrase stuck with me.
subscribe to ![]() this site.
|
contact Michal Migurski
this site.
|
contact Michal Migurski