tecznotes
Michal Migurski's notebook, listening post, and soapbox. Subscribe to ![]() this blog.
Check out the rest of my site as well.
this blog.
Check out the rest of my site as well.
Feb 4, 2013 1:38am
week 1,837: typescripting
This has been week six of self-exile and funemployment.
Since JS.Geo, I’ve been reflecting on the world-consuming popularity of Mike Bostock and Jason Davies’s D3 library and giving it a repeat test-drive. I think there are two fascinating aspects to the public response to D3 at events like JS.Geo: everyone wants to do something with it, but very few people claim to understand it. I attempted to explain the “.data()” method to a friend at JS.Geo and realized that I also was missing a critical piece myself. One metaphor I’ve been using to think about D3 has been performance: Mike and Jason are so deeply good at what they do and create such a prolific stream of examples that just watching the work is like a stage performance. They’re the current reigning Penn & Teller of Javascript, the Las Vegas tiger guys of SVG, and you can’t not be fascinated even as your watch disappears. The problem with this metaphor is that it puts up a wall between you and the code, frames it as an unobtainable skill. There’s not much you can learn about personal fitness from watching a professional dancer at work. So, performance is an unhelpful metaphor.
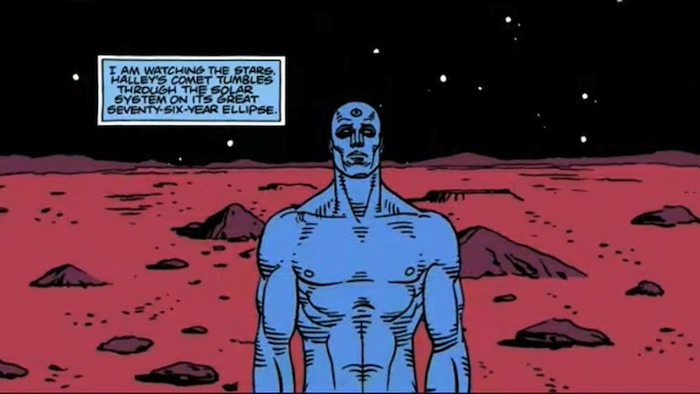
A more useful metaphor I’ve been exploring in code this week is D3 as nuclear fuel. This starts to feel a bit more helpful, because it suggests a clear approach to D3 for mortal developers: use the power, but keep it carefully contained. It’s the same line of thinking suggested by Rebecca Murphey’s argument about jQuery: “it turns out jQuery’s DOM-centric patterns are a fairly terrible way to think about applications,” leading to Tom Hughes-Croucher’s idea of pyramid code, “huge chains of nested, dependent anonymous callbacks piled one on top of another.” With great power comes great blah blah blah. Observing Dr. Manhattan offers little guidance for building a power plant.
I’ve always enjoyed strongly-typed languages for interactive work, so this week I have been approaching the use of D3 from the direction of Typescript, Microsoft’s typed superset of JavaScript that compiles to plain JavaScript. The Typescript team have helpfully created a starting set of declarations for D3, making it possible to use the relatively-structureless method chains within a more controlled environment.
I’m surprised at how much I enjoyed Typescript, and how comfortable it felt immediately, and how fun it’s been to bounce a free-form library like D3 against a strictly-typed language environment, like a super ball off a concrete wall. My test project is a fork of Tom Carden’s D3Map, an exercise in learning D3 for DOM manipulation and transitions. Play with it live at bl.ocks.org/4703593. You can use Typescript to write legible, self-describing code with clearly enforced expectations like Grid.ts. You can also keep the D3-needing parts carefully separated from the tile math like Image.ts and Mouse.ts. The additional structure demanded by Typescript felt surprising calming, like Allen Short’s 2010 PyCon talk on Big Brother’s Design Rules (via War is Peace):
- Slavery is Freedom: the more you constrain your code's behavior, the more freedom you have to act.
- Ignorance is Strength: the less your code knows about, the fewer things it can break. This is itself a play on the Law of Demeter or principle of least knowledge.
The one major bump I experienced with Typescript was in deploying to a browser. Although Typescript files compile to Javascript, they include calls to “require(),” a part of the CommonJS spec. This is not browser-kosher, so I used Browserify in the Makefile to generate a browser-compatible file with an extra 9KB slug of CommonJS overhead.
All of this has been a step on the way to a browsable WebGL map, one of my goals from last week.
I have also significantly updated the visual appearance of Green Means Go to make it more legible and hopefully printable.
No current progress on Metro Extracts.
This week, I’ll be doing some consulting and some future conspiracy planning. People will be visiting town, and I will have beers with them.
subscribe to ![]() this site.
|
contact Michal Migurski
this site.
|
contact Michal Migurski