tecznotes
Michal Migurski's notebook, listening post, and soapbox. Subscribe to ![]() this blog.
Check out the rest of my site as well.
this blog.
Check out the rest of my site as well.
Apr 15, 2011 5:40am
last week: NoGIS
On Wednesday last week, Sha Hwang and Zain Memon of Trulia née Movity hosted the first “NoGIS” meetup at their San Francisco office. I opened, SimpleGeo’s lead architect Mike Malone followed, and Stamen alum Sha Hwang closed out the night. In the audience were many of the folks mentioned in this talk: Mike Bostock of Stanford University and Polymaps, Mano Marks and Josh Livni from Google, Schuyler Erle from SimpleGeo and elsewhere on the geoweb, Tom Carden of Bloom.
Patterned on 2009’s “NoSQL” trend, this new name began as a tongue-in-cheek joke and seemingly transformed into a viable series of talks.
The previous week saw a medium-sized Tweetstorm of speculation as to the meaning of the name: was this round two in the old paleo- vs. neogeographer grudge match? Were we hoping to crush the rich history of GIS and geography under our boot heels? Was the meetup going to attract a crowd of arrogant 20-year-olds? Generally speaking, none of those things are true. I can report that the overarching theme of the talks was a shift in focus, from geoprocessing with publishing as an output, to geopublishing with processing as an input. NoGIS is a response to a shift in the technical environment, encompassing new strategies for scaling large data sets and and new responses to a rapidly shifting client-side browser execution environment for dynamic content.
To put it another way: big databases, tiles, and Javascript.
I promise that these notes bear a non-coincidental resemblance to what I actually said on Wednesday.

Ordinarily, you expect triplets like this to force a choice: Fast, Cheap, or Good: Pick Two. We’ve been developing approaches at Stamen for the past few years that value a form of simplicity or “dumbness” around the deployment of projects, to help eliminate some of the uncertainties around launching projects and keeping them launched.
Stamen is a service business, which mostly just means that we have clients who write us checks in exchange for the work that we do. This is one of the few non-negotiable constraints on our process: when the last check clears and everyone shakes hands, the things we build must continue to work out on the web. We can’t afford much creativity in how we deploy projects—they have to be fixable and comprehensible to the kinds of administrators and generalists available to corporations, cultural institutions, museums, services, charities, societies, and other Stamen clients.

Stamen is also a design firm, and the majority of our work is intended for public consumption. We produce visual interpretations of flowing data that must be understandable to a lay audience, often for clients who have an expert’s familiarity with that data and need to communicate it simply. We might be dealing with climate change datasets one week, transportation numbers the next, and iterating on a project around Kanye West’s tweets throughout that time. Lots of variability here.
The easiest way I can think of to contextualize the title of this talk and the fuzzy concept of “NoGIS” in general, would be to contrast it with the mission of geography and by extension traditional GIS: smart, correct, and generalized techniques for dealing with spatial information.
In response to Sean Gorman’s first blog post on NoGIS, Eric Wolf had this to say:
One of the “features” of big-name GIS is a set of “standard” geoprocessing operations. I believe the concept stems originally from Goodchild’s GISystems vs. GIScience articles in the early 90s. The idea is that these geoprocessing operations would be sort of like the tool bag of tests wielded by statisticians. That the people wielding the operations would be Geographers rather than Computer Scientists. Goodchild wanted to keep GIS inside of Geography and not let it become a specialty area in Computer Science.
That’s really it in a nutshell: standard operations on data for Geographers, with the attention to detail and accuracy that you might expect from domain experts dealing with complex data sets.

One of the first things that academic geography and traditional GIS values is the idea of a projection: a transformation from the round earth to a flat map. In the case of projections like the Universal Transverse Mercator grid, the point is to convert spherical geometry to something that can literally be used with a piece of paper and a ruler. This theme of tool-appropriateness will repeat itself a few times, and in large part I think the bias of a given “worldview” in disciplines like GIS is really something governed by the particular technosocial relationship between the user and the object.

Projections also are the first confusing thing for non-GIS people. Everyone knows the earth is a spheroid, and generally systems like Google Maps or GPS will express locations in terms of latitude and longitude. These are easy to visualize in your mind. If you’re a surveyor or other engineer, these units are a problem and so you must use one of the thousands of shared projections in the world, like the U.S. State Plane system, to flatten your local area so that your measurements can shake out on plans and drawings. Most people are not surveyors, and so when they visit the DataSF collection and find that all the street centerlines are in something called “California State Plane III”, they become confused. Schuyler Erle shouted “meters or feet?” at this point.
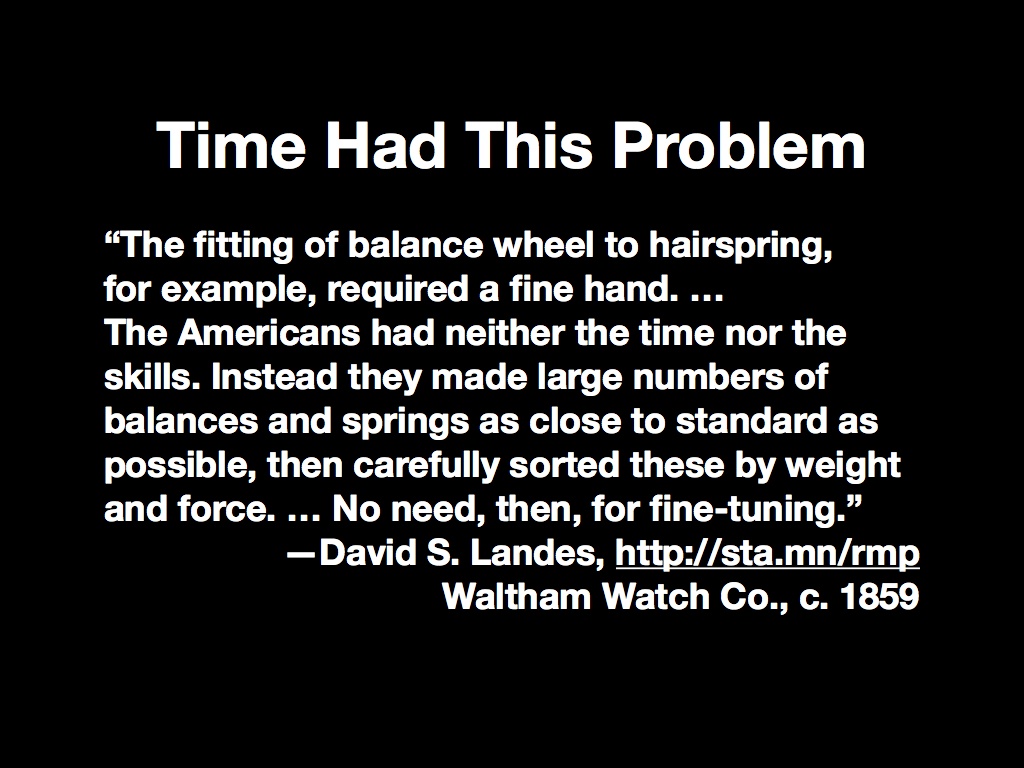
It’s worth noting that this kind of complexification for newcomers isn’t a problem unique to geography. Measured time had it too, with the expensive and painstaking process of building a quality watch making the idea of punctuality inaccessible to most people. New, seemingly-shoddy American development practices and the needs of mass coordination of soldiers in the U.S. Civil War put precision time into the hands of ordinary people.
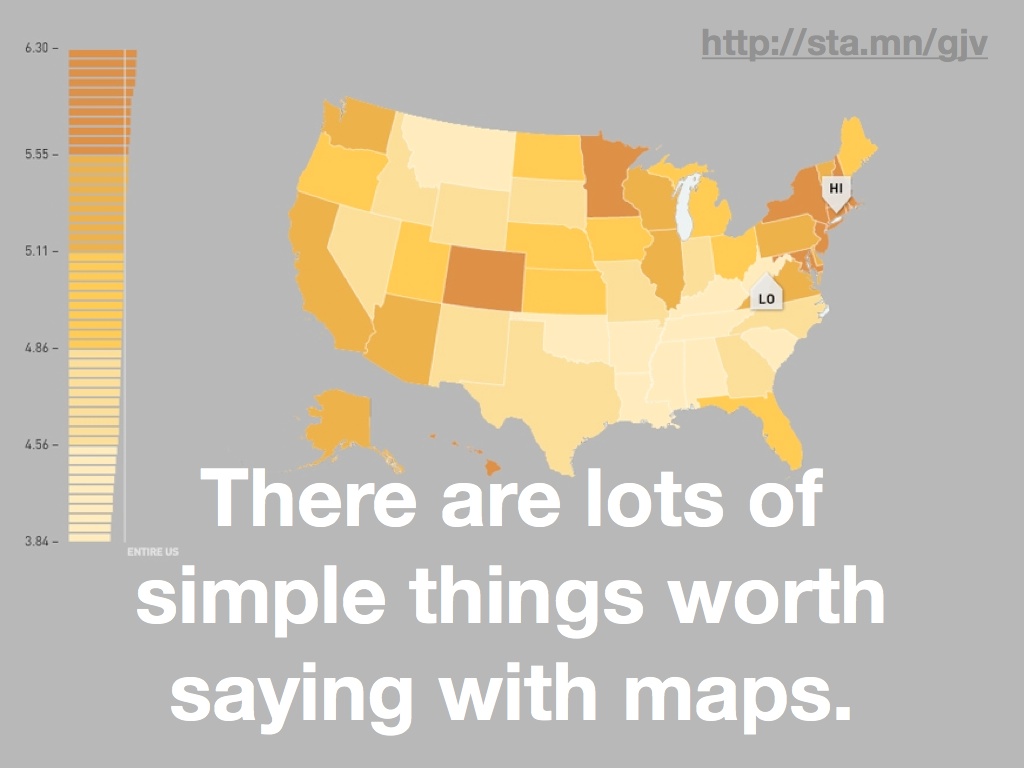
The thing is that there is a lot of geographic data that’s simple to display, and a lot of things worth saying with simple data.

This rent vs. buy map from our hosts at Trulia is an example of complex data boiled down to a simple visual display. Here the specific projection used is not really important, and the data display of each market’s price characteristics doesn’t really conform to the layers of data paradigm assumed in most GIS tools. It’s just not the same thing, but it has tremendous value. The biases are different, it’s more directly communicable, and there’s a more obvious visual payoff with the big red dot in New York.

The complexity of GIS took a turn about seven years ago, give or take.
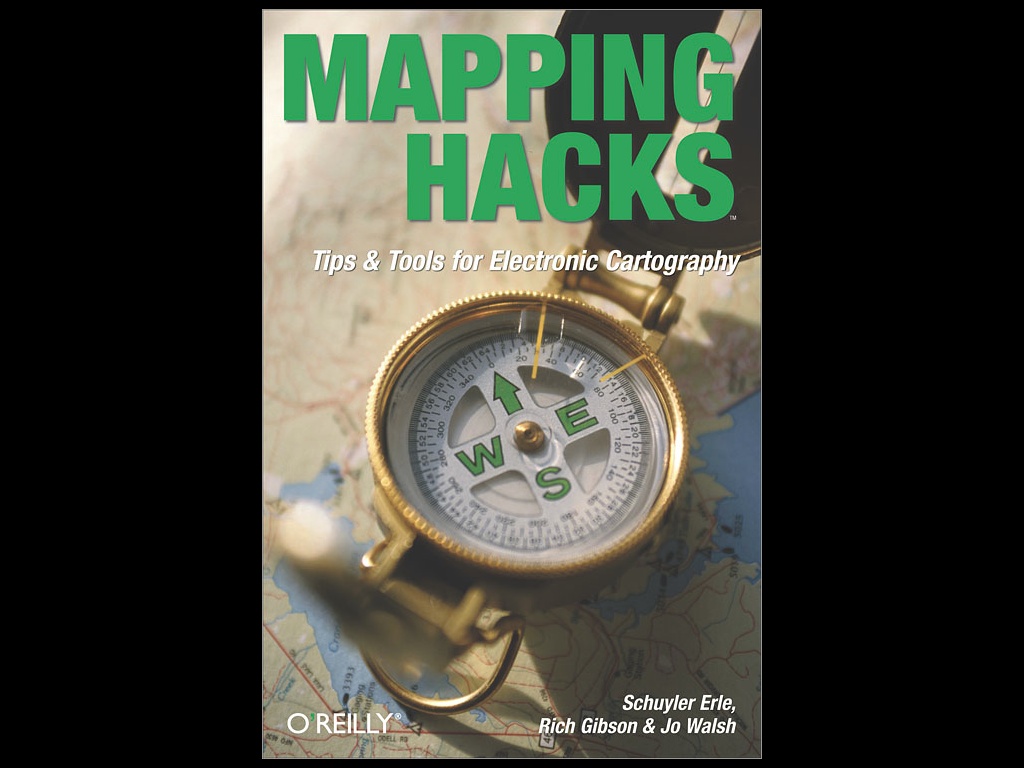
First, O’Reilly’s book Mapping Hacks was published, in which Schuyler Erle, Jo Walsh, and Rich Gibson explained how geographic tools could be used by the more traditional Unix hacker audience of O’Reilly’s books. While many of the file formats in the book came from the universe of traditional GIS, the reversion back to command line and script mentality was an interesting shift. Here you had a world of Linux users accustomed to batch processing and text-based interaction starting to realize that geography, too, was in their reach. This interest in processing ran contrary to the historical trend toward graphical user interfaces, but it put the tools of geoprocessing into the hands of the most vocal open source community.
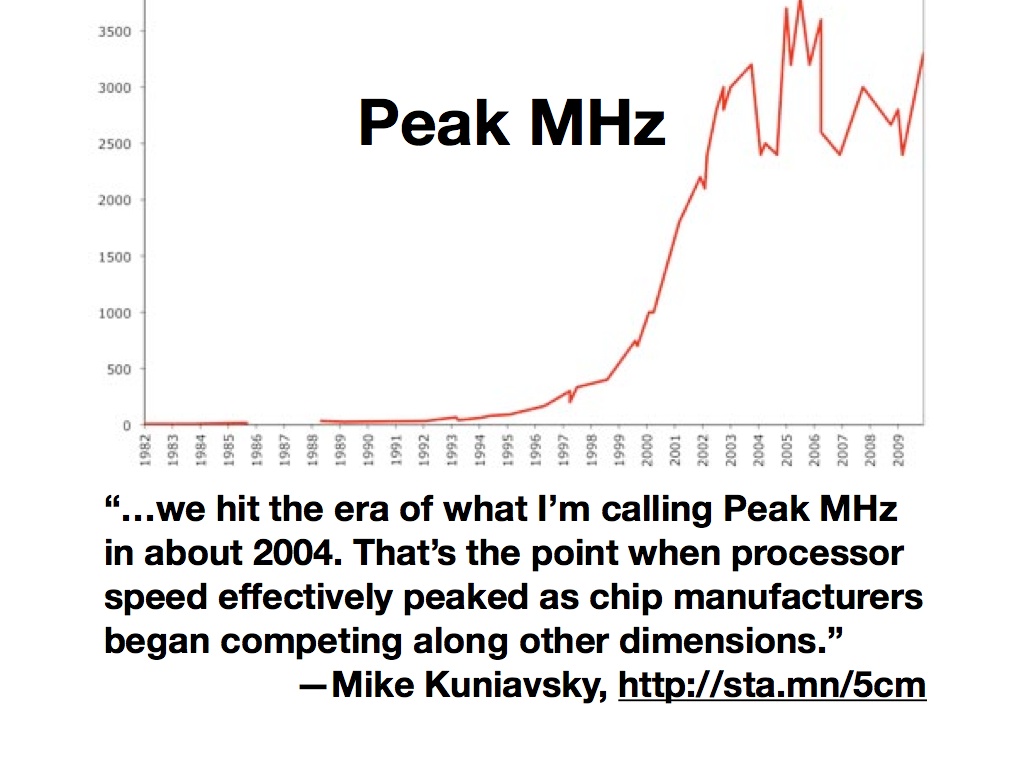
Around the same time, the CPU speed race began to slow down. Mike Kuniavsky calls this “Peak MHz”, and notes that attention shifted away from ever-more-vertiginous processor speeds to new dimensions of competition: power consumption, physical size, cost. The practical effect of this for GIS was that you could no longer rely on next year’s computers making your work faster by default, and for developers it became necessary to respond to the change by modifying development tactics. Storage, for example, continued to get cheaper by the gigabyte, so it began to make sense to precompute things like basemaps or data collections into readily retrievable forms.
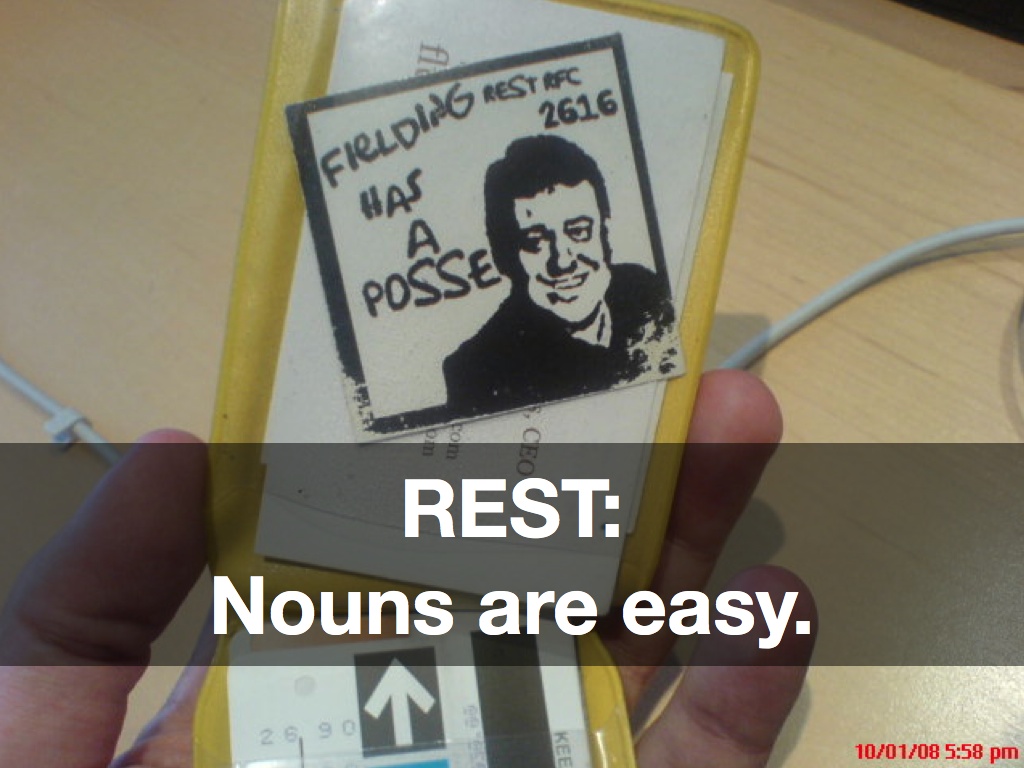
Finally, Roy Fielding’s 2000 thesis on architectural styles in network software began to get an increasing amount of attention. This is the year I first heard the term “REST”, and it instantly struck a chord with me. Specifically, it showed a clear path from remote-procedure-based communications toward a hypertext-driven exchange of representational states. A switch from verbs to nouns, in other words. We’ve seen how Peak MHz capped the speed of verbs, but nouns continued to get cheaper to store and serve.

The noun that everyone thinking about NoGIS is probably most familiar with is the lowly map tile, that 256x256 pixel building block of most modern browser-based cartography. In early 2005, Google released its Maps product onto the web, showing how a country’s worth of complex geographic data could be beautifully pre-rendered and served at web speeds in a dynamic, interactive container. Overnight, the server-side CPU-intensive but primitive-looking cartography of MapQuest went out the window in favor of “slippy maps” built out of tiles.
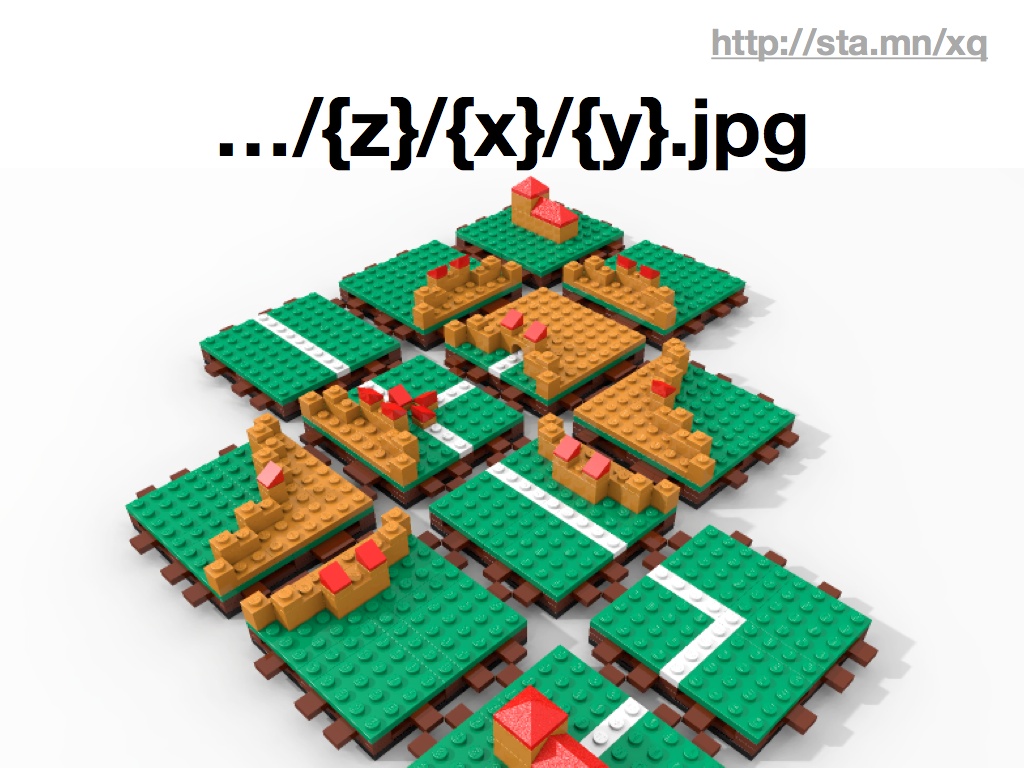
Tiles happen to have an incredibly simple API. At this point, many of the early tile naming schemes like Microsoft’s “qrst” and Google’s “0123” quadtree conventions have been replaced with much simpler, more transferrable “Z/X/Y” coordinates. The ubiquitous use of the spherical mercator projection, which offers simpler arithmetic by assuming a spherical earth and square base map, makes the tiles for one imagery provider essentially interchangeable with any other.

Stamen’s done a few projects over the years that we think are good examples of NoGIS in action. All of them feature maps on some level, but deviate from the traditional analytic and process role of GIS to something more in the realm of pop culture and publishing.
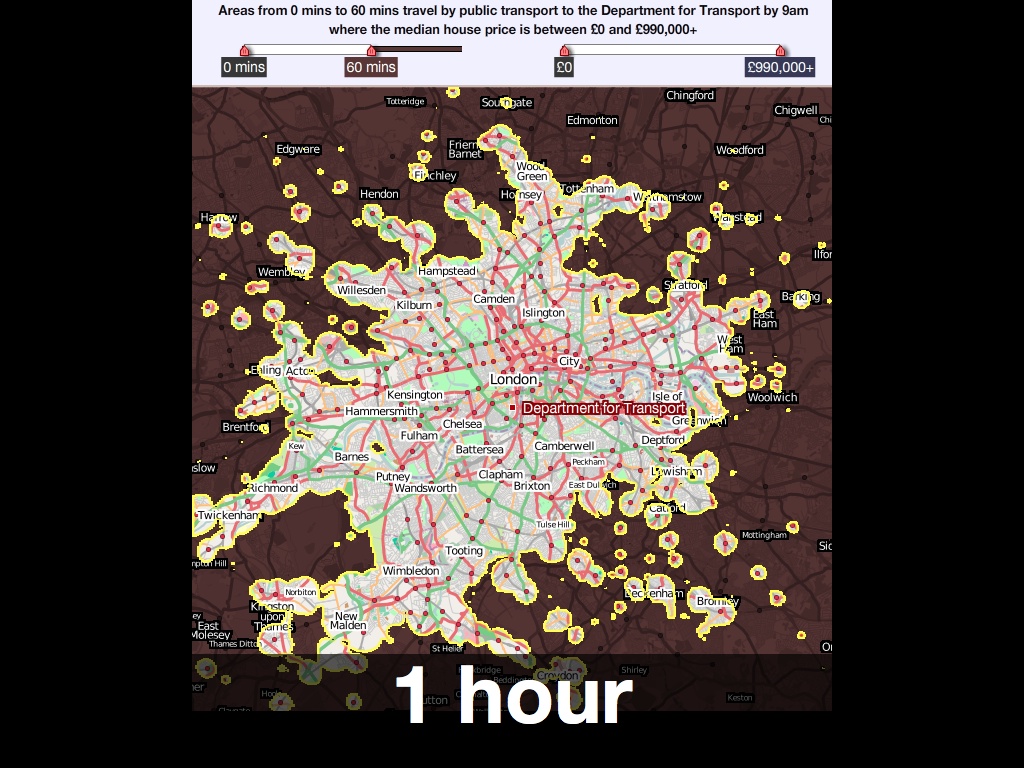
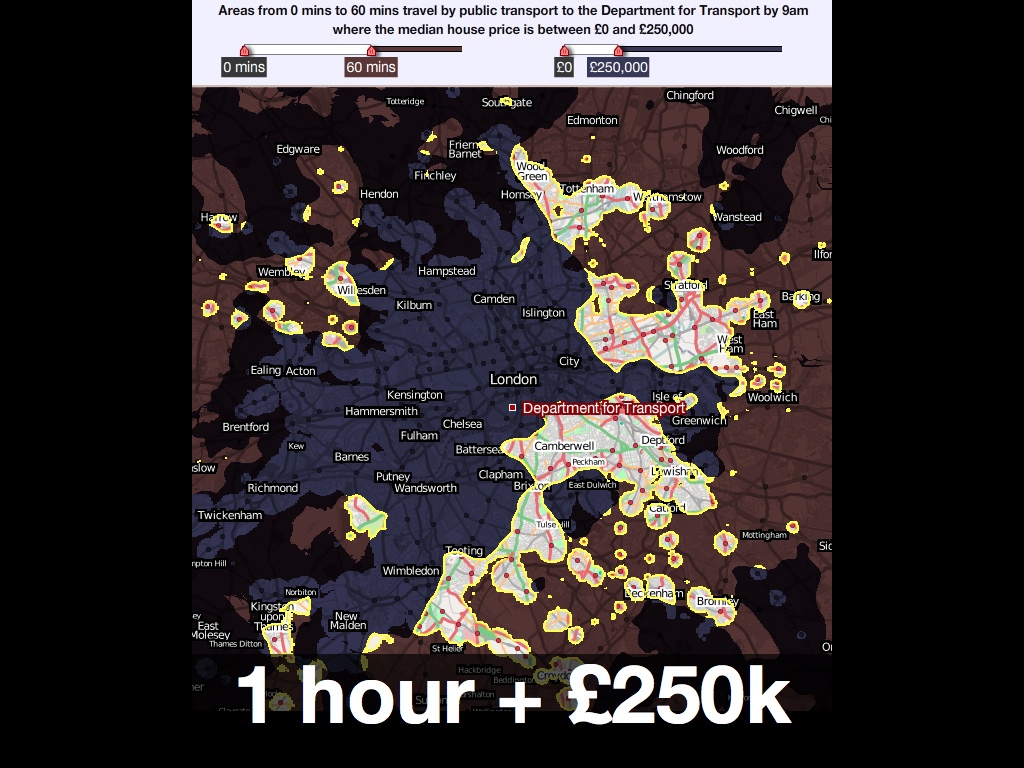
We worked with MySociety a few years ago to produce these interactive maps of London. They were based on housing price and commute time data, and featured a pair of simple sliders for selectively limiting display to a range of acceptable prices and times, something like an amoeba-shaped Venn diagram. As you moved the sliders, the parts of the map outside your parameters would go dark, giving you an immediate shape of where you might reasonably look for a home in London.

The nicest thing anyone ever said about it was this:
“… in three clicks it reveals what it took us years to learn: that the only place you can buy a house for £300K and still live 30 minutes from your office is the Kennington / Oval / Vauxhall triangle.”
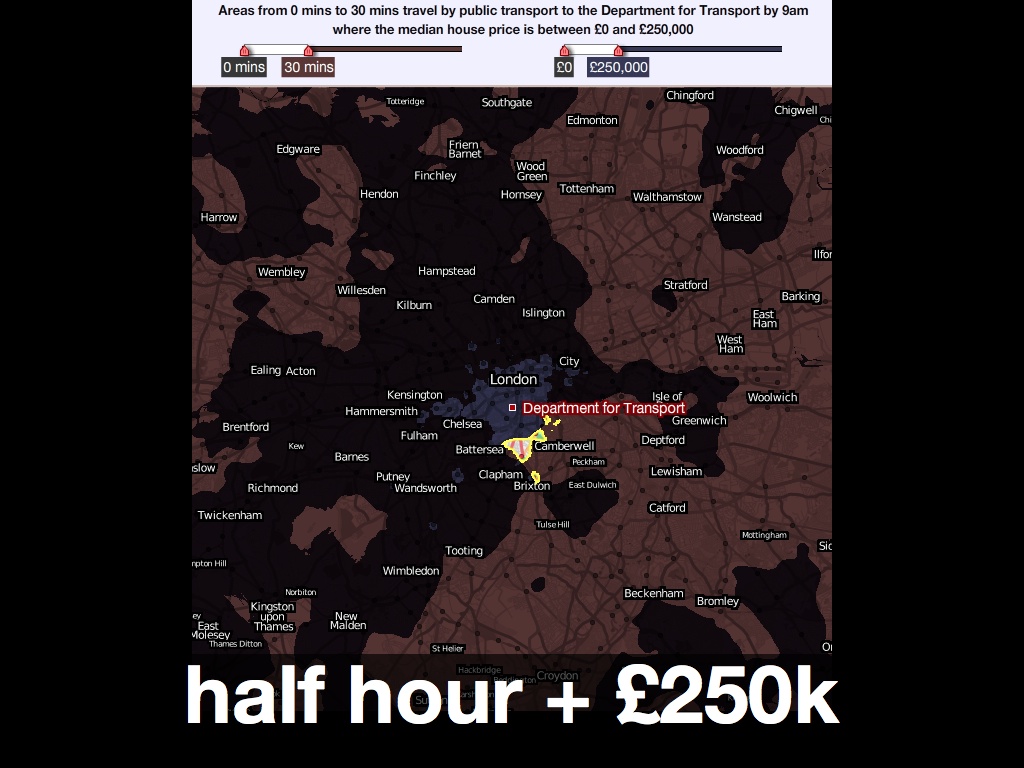

The MySociety map was based on a technique that takes advantage of the dynamic pixel-based processing possibilities available in Flash at the time, and Javascript canvas today. Map tiles don’t need to show images, they can also use the numeric color values in each pixel to carry data like time or identifiers. Sha Hwang’s talk later in day showed how Trulia is using this technique with census and other geometries to investigate color options in the browser, all based on cheap-to-host pre-rendered map tiles.
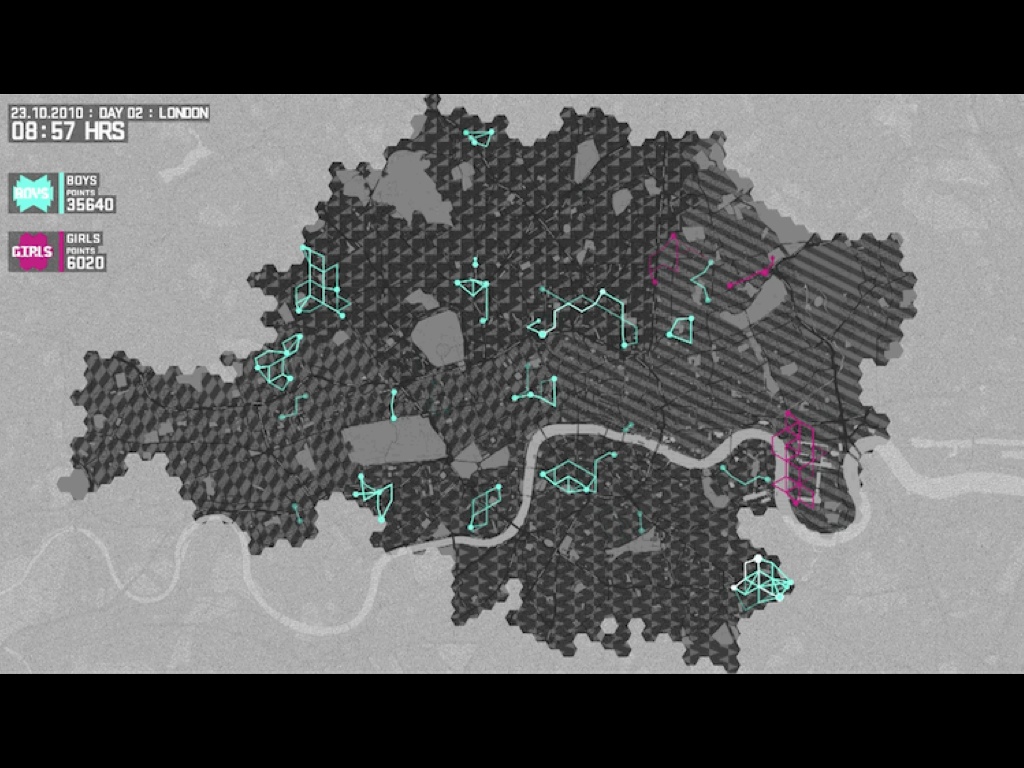
Late last year, we worked with Nike and W+K to create this dynamic map of London for the Nike Grid game, a two-week long distributed race around town using phonebooths as checkpoints and collecting and republishing data on a daily basis.

The visual design of the map was based on Nike’s existing art direction, and was not unlike our Midnight Commander cartography for Cloudmade. It was also developed using open sources of data like the Ordnance Survey’s post code points and OpenStreetMap for streets. This project had to be handed off to an advertising firm, and although it was live for only a few weeks it was important that they be able to host the cartography and other elements with minimal fuss. No fuss is more minimal than a simple bag of image files on a web server.

Back to the subject of tools, there’s an incredible gesture of re-appropriation in the Nike Grid project. The geographic expression of the data in Nike Grid skipped technologies like GPS entirely, and instead borrowed BT’s phone booth infrastructure, at this point just a distributed network of support structures for advertisements. Runners would check at various points in the grid run by dialing numbers from specific booths with their personal ID numbers.
It may not look like GIS, but these participants are taking advantage of deep backbench of geospatial technologies.

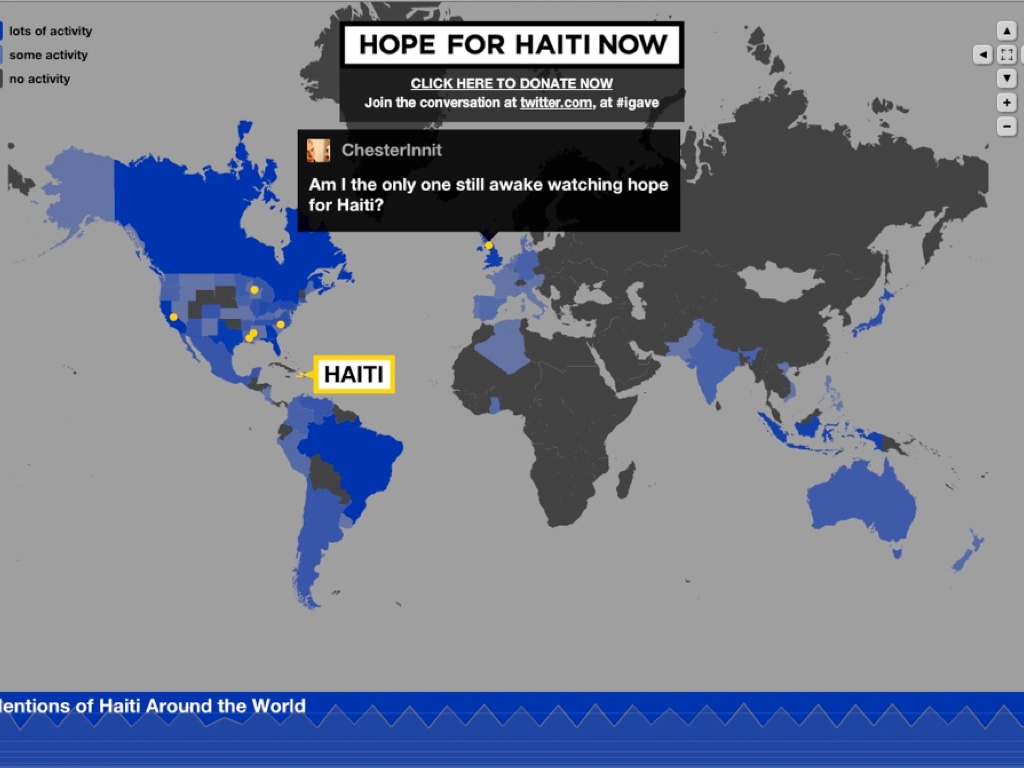
One week after the 2010 Haiti earthquake, George Clooney hosted the Hope For Haiti Now telethon and raised an astonishing $60 million for victims of the disaster. We took part in MTV’s broadcast of that telethon, with a rapidly-built dynamic map that collected data in realtime from Twitter users and displayed messages of support and encouragement on the open web and in the post-show. The dynamic map we developed categorized tweets into countries based on each user’s self-reported location, and displayed a selection of those tweets on a pulsing, shifting display.
This is really an example of speed, and shows how a geographic display can be used to communicate energy and participation, regardless of the particular details of the geographic projection or even the strict accuracy of the geolocation process. In this project, visual impact was key and the input was often messy. Did you know that running “inurass” through the Yahoo! geocoder gives a response of “Nagasaki, Japan”?
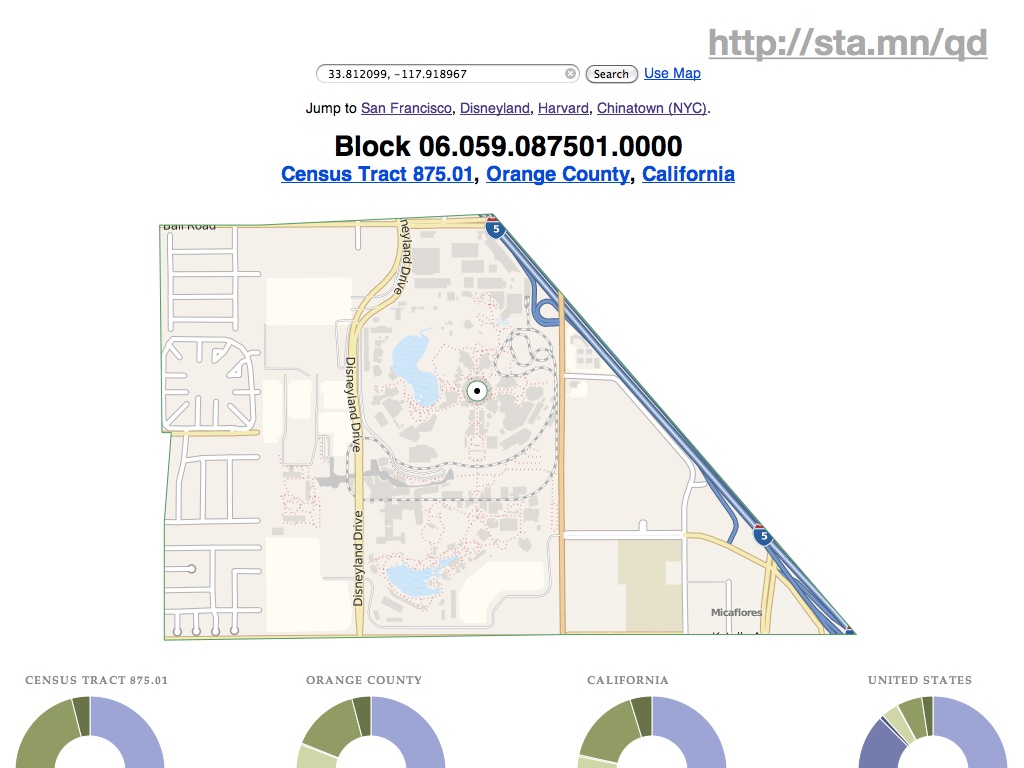
The last project I mentioned is This Tract, a browser-based viewer for Year 2000 U.S. Census data. This was a research project, looking at methods of deploying geographic data on the static file-hosting platform S3. It’s an experiment in late-binding: how possible is it to assemble completely static data from a variety of web sources in the browser, creating a dynamically-generated page that might ordinarily come from a server-side script or application.
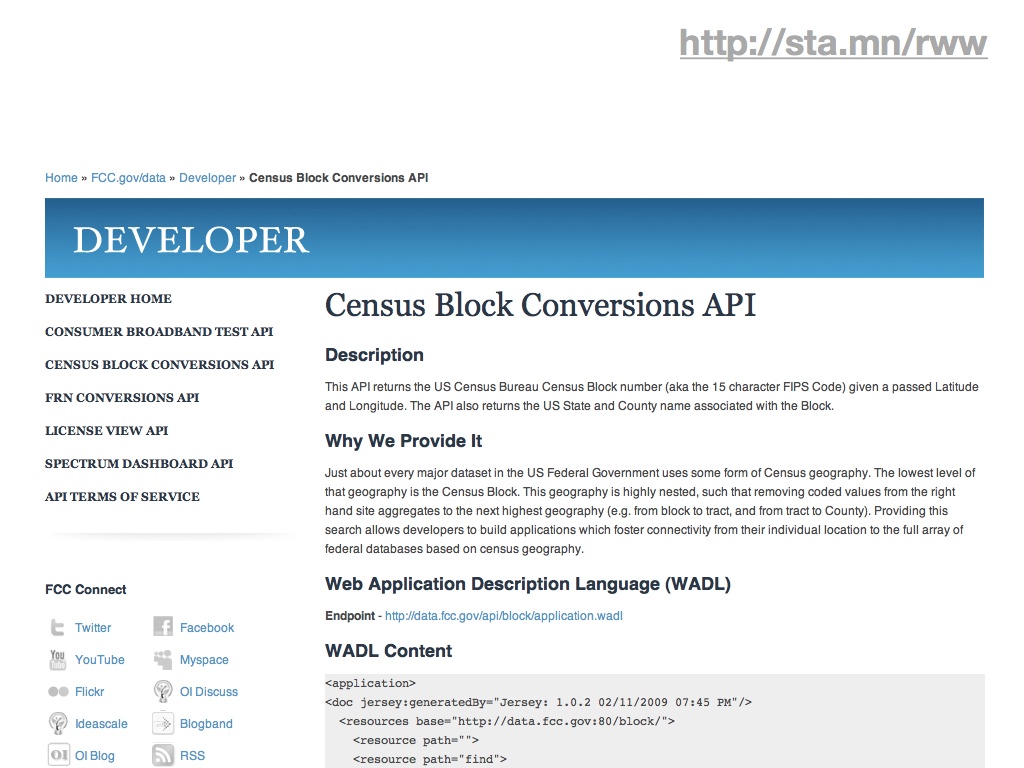
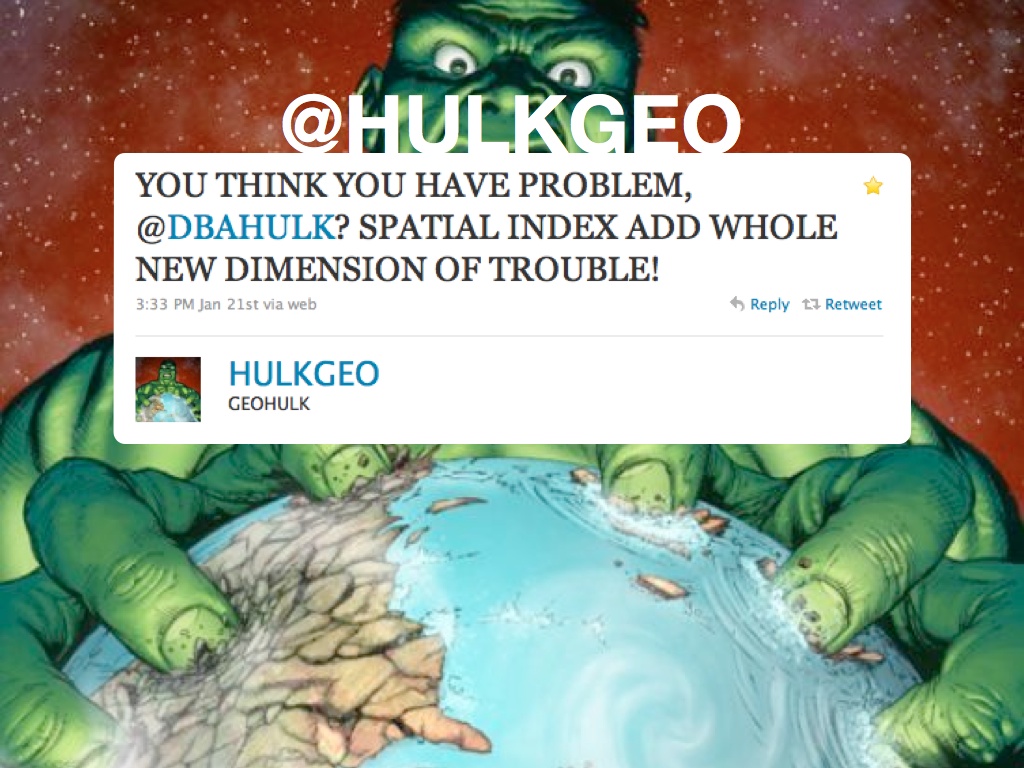
It’s possible to get around the spatial index problem by offloading the requirement to external, public services, in this case the FCC’s Census Block Conversions API. The service accepts a latitude and longitude from browser-provided geolocation information, and converts it to a Census block ID. From there, it’s just a few string manipulations to the tract, county, and state summary levels. This pattern of using one dynamic service to come up with a foreign key into another is one that will repeat. It’s made doubly-powerful by the work put into naming conventions and code design by the U.S. Census.
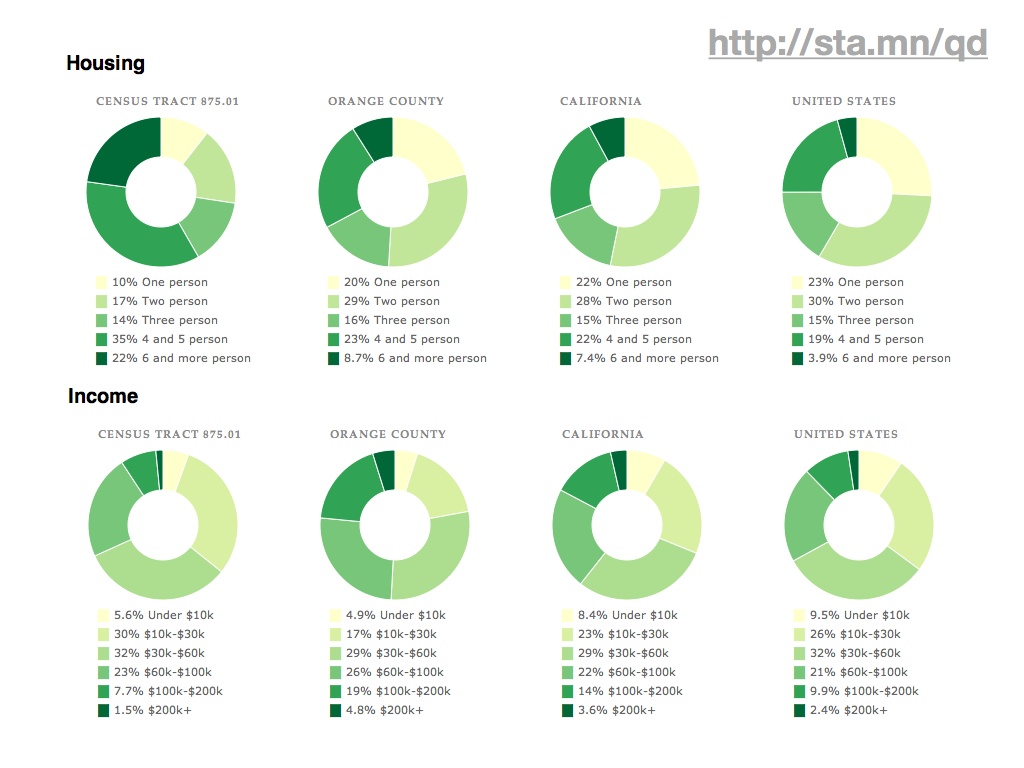
Ultimately, the application provides a fairly simple, big-here/small-here view into demographic data. On the left column are statistics for the typically-neighborhood-sized tracts, while to the right are numbers for increasingly-general areas: the county, the state, the country. Here you can see that housing and income around Disneyland (California tract #875.01) are lower and more crowded than elsewhere in the same county. These donut charts, like the map above and every other component of the page, are built using new Javascript and HTML5 features such as the drawing canvas, SVG, and the graphing library Protovis.
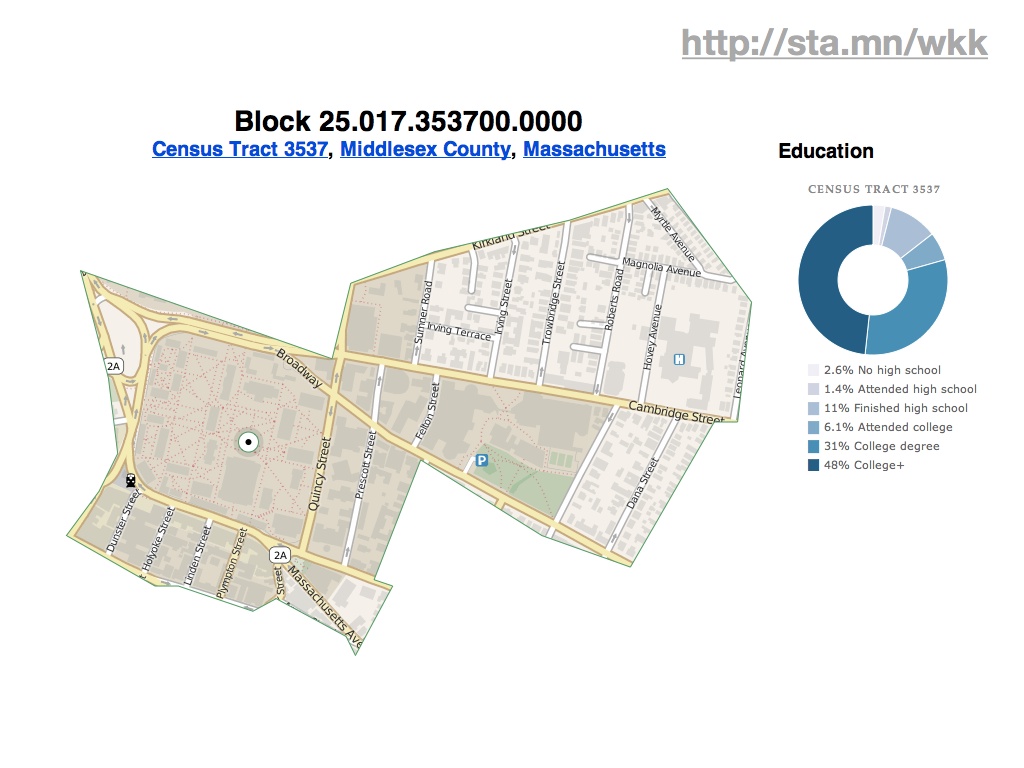
You can drill into individual tracts across the country, such as this highly-educated area directly around Harvard University…

…or this unusually older waterfront community in Florida…

…or this minimum-population leper colony in Hawaii.
Where you end up with this new environment is something like Polymaps, developed at Stamen with Mike Bostock and SimpeGeo last year. Polymaps explicitly turns its back on Internet Explorer in favor of vector graphics and dynamic features in new browsers. If you’re interested in where a possible future for a trend like NoGIS might lie, you could stop here and have a pretty good idea. Native support for GeoJSON-formatted vector tiles, visual display assembled client-side, and support for numerous background imagery providers.
In looking back on these selected projects, what are some of the simplifying assumptions that made them fast, cheap and easy to launch?
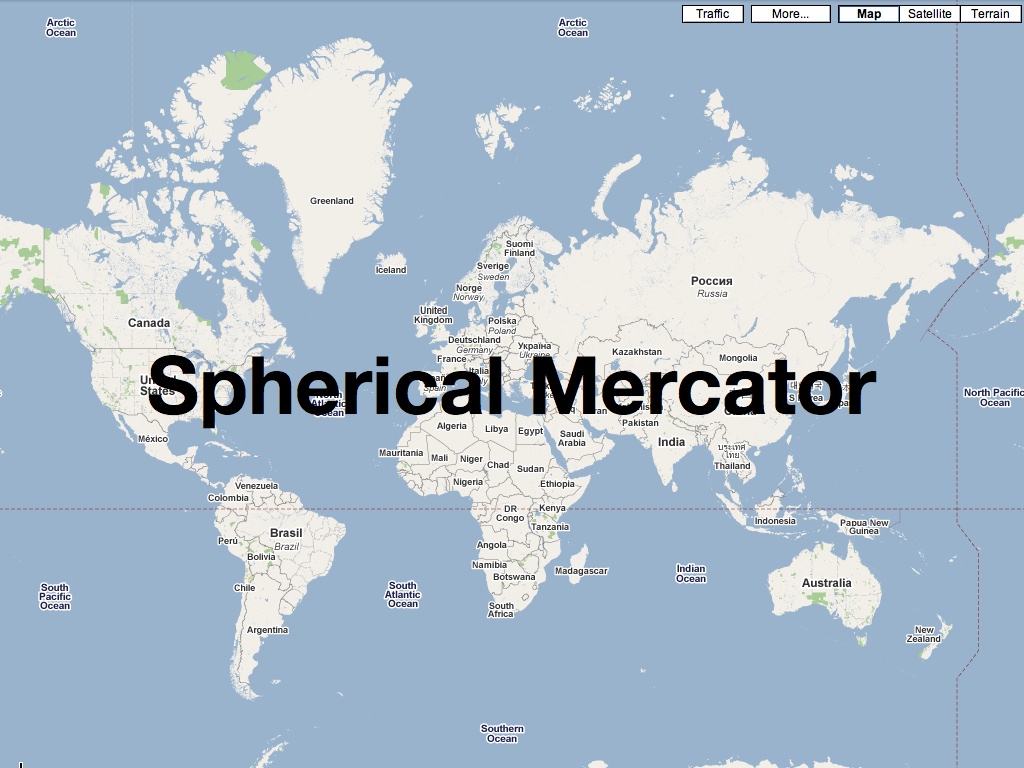
First is the use of the popular spherical mercator projection, or “popular visualization CRS” as it’s referred to by the EPSG and other projection authorities. You can almost taste the contempt in a name like that, and in fact for some time the normal categorizing authorities refused to give this common projection an official number, leaving geographic developers to use the clumsy, cheeky “900913” designation (hint: it’s in calculator writing). Spherical mercator has a number of properties that make it ideal for web-based use: the projection math is simple, and if you’re willing to ignore the North and South poles it’s possible to render the entire planet in a neat square shape that’s a snap to decompose into quarter tiles. At high zoom levels it’s conformal, at low zoom levels it looks as familiar as the world map on the wall of your second grade classroom, and as long as you’re not using it to build a sewer it’s probably a good-enough approach.

Second is to pay attention to the tools at hand. In some cases, that means using Adobe Flash to distribute cartographic visualizations, as we did with the Hope For Haiti Now and MySociety examples. In other cases, that means using Javascript. In most cases, it means reaching for what’s comfortable rather than what is strictly correct. We’re actually in an very uncertain time in this regard—Sha Hwang quoted Tom Carden by saying that for dynamic interactive work, you generally must choose between spurning the iPad or Internet Explorer users. That situation is likely to continue for some time, at least until IE9 sees hoped-for broader adoption.
In some ways, the whole NoGIS concept can be boiled down to a movement away from relying on rising processor speeds to paper over rushed development practices. While we often find ourselves pegging all sixteen processors of a colossal server to prepare tiles and other data for publishing, once it needs to go out in the world it’s enough to rely on part-time Apache admins or blob storage services like Amazon’s S3. The real key here is assembling raw geographic data components in the end-users browser rather than the server.

subscribe to ![]() this site.
|
contact Michal Migurski
this site.
|
contact Michal Migurski