tecznotes
Michal Migurski's notebook, listening post, and soapbox. Subscribe to ![]() this blog.
Check out the rest of my site as well.
this blog.
Check out the rest of my site as well.
Dec 5, 2011 8:19am
OSM terrain layer: background tiles now available
Lots of progress this week on the map, including state borders, more city labels, parks, and improvements to highway rendering at low zoom levels. Some forthcoming progress, too: more states, local points of interest, and Nate Kelso’s airport data and icons.
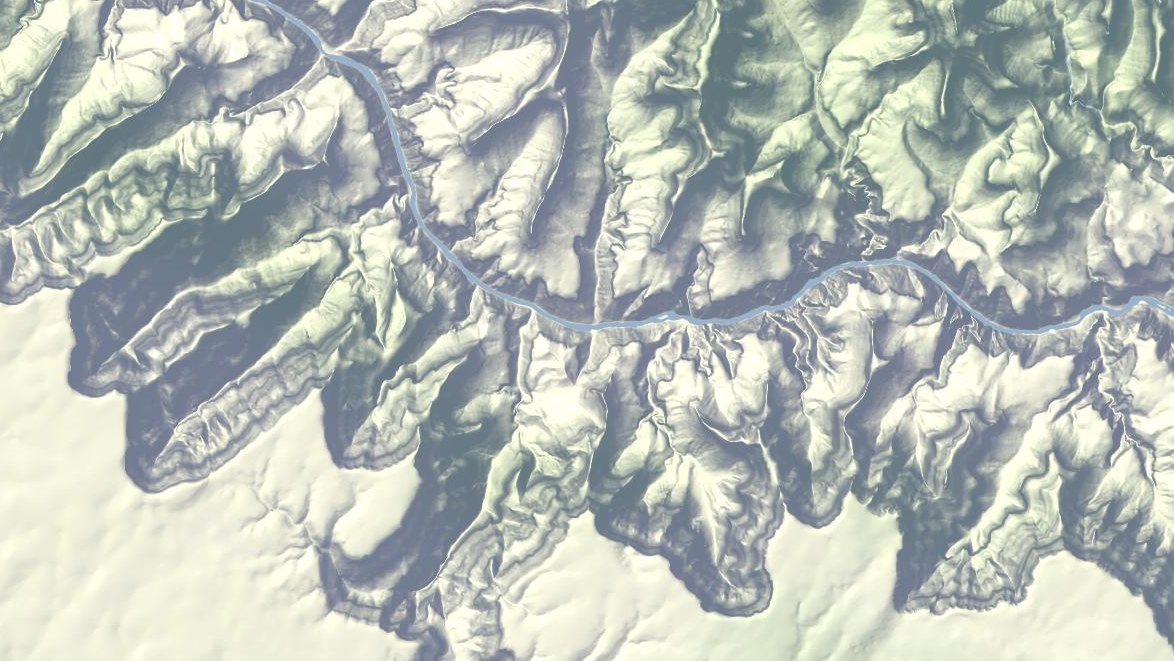
The thing that’s definitely ready is the base terrain, so I’ve decided to give it a little push before I release the rest of the map. Look, here’s a tile. This is another, and this is an interactive preview (shift-double-click to zoom out). Tile URLs come in the same format as other slippy map tiles, they look like this:
http://tile.stamen.com/terrain-background/zoom/x/y.jpg
You can add a subdomain to the beginning to help pipeline concurrent browser requests, e.g. a.tile.stamen.com, b.tile.stamen.com, up to d.
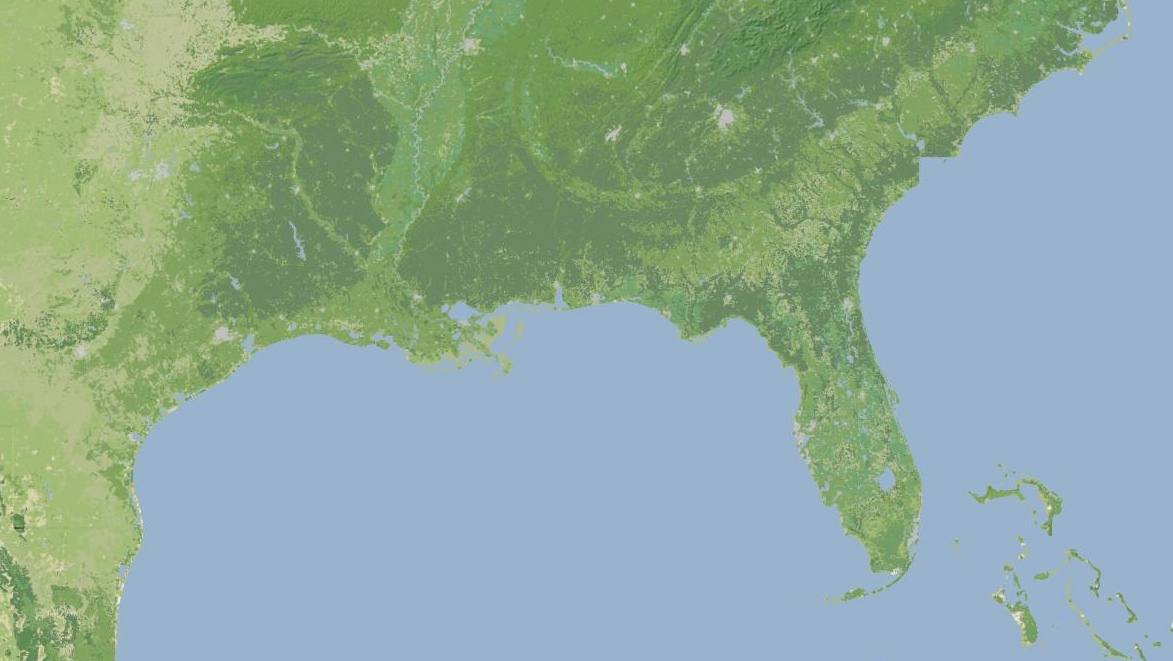
This terrain background tile layer is intended for use where you might otherwise choose satellite imagery because you don’t want text or other map junk showing up. It’s meant to recede quietly into the background, give useful terrain context, and look good with points and data in front. You can use them with OpenLayers, Modest Maps, Leaflet, Polymaps and even the Google Maps API.
The tiles are defined for the continental United States, and include land color and shaded hills. The land colors are a custom palette developed by Gem Spear for the National Atlas 1km land cover data set, which defines twenty-four land classifications including five kinds of forest, combinations of shrubs, grasses and crops, and a few tundras and wetlands. The colors are at their highest contrast when fully zoomed-out to the whole U.S., and they slowly fade out to pale off-white as you zoom in to leave room for foreground data and break up the weirdness of large areas of flat, dark green.
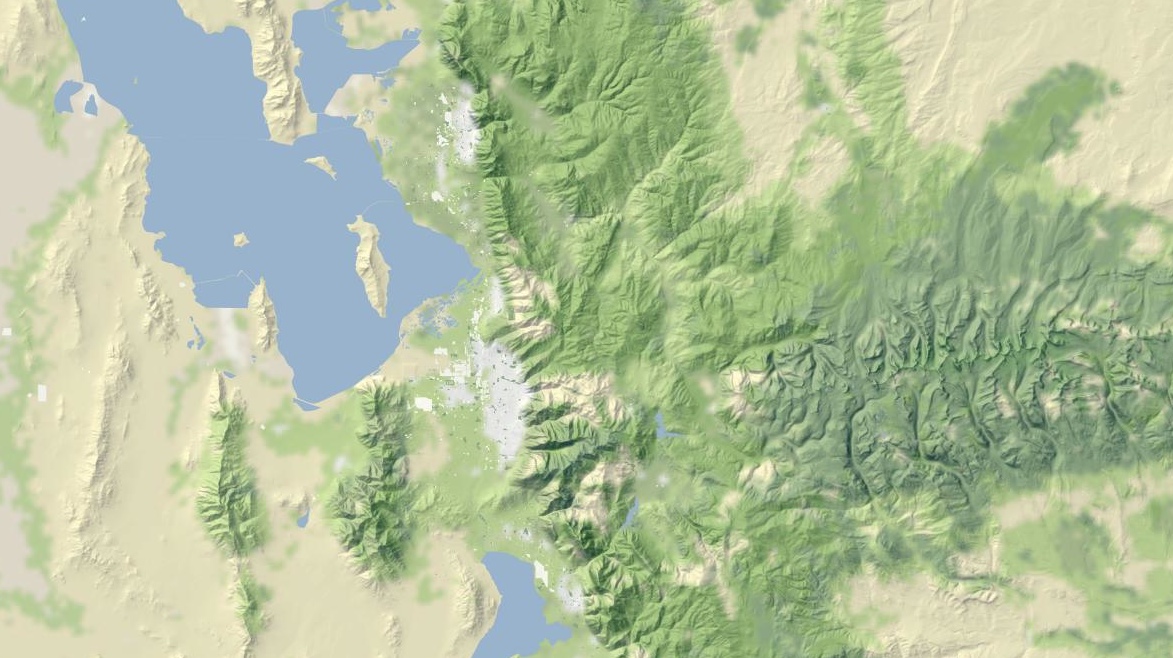
Also at higher zoom levels, details from OpenStreetMap such as parks and land use patterns begin to show up, as in this example of Almaden Valley and the Santa Cruz Mountains:

The hills come from the U.S.-only ten-meter National Elevation Dataset, which allows for usable hills at zooms as high as 16 or 17. Instead of cross-blending NED 10m with SRTM and its many holes, I’ve simply downsampled the full resolution data to provide for smoother hills at lower zooms, and over time I’ve come to prefer this approach to Google Terrain’s much more crispy hills.
There’s some mildly interesting stuff going on with the shading, where I’ve decided to pre-process the entire country down to zoom 14 “slope and aspect” tiles (in some places, zoom 15) stored in two-channel 8-bit GeoTIFFs compressed with JPEG at quality=95 (here’s a sample tile for Mount Diablo—check out its two channels in Photoshop). The short version of this is that every bit of elevation data is stored in a form that allows for rapid conversion to shaded hills with arbitrary light sources, and still compresses down to sane levels for storage. It’s a happy coincidence that 256 levels of 8-bit grayscale is enough to usefully encode slope and degrees of aspect, though it took a bit of trial and error to determine that JPEG quality really needed to be 95 to remove ugly artifacts from the shaded output.
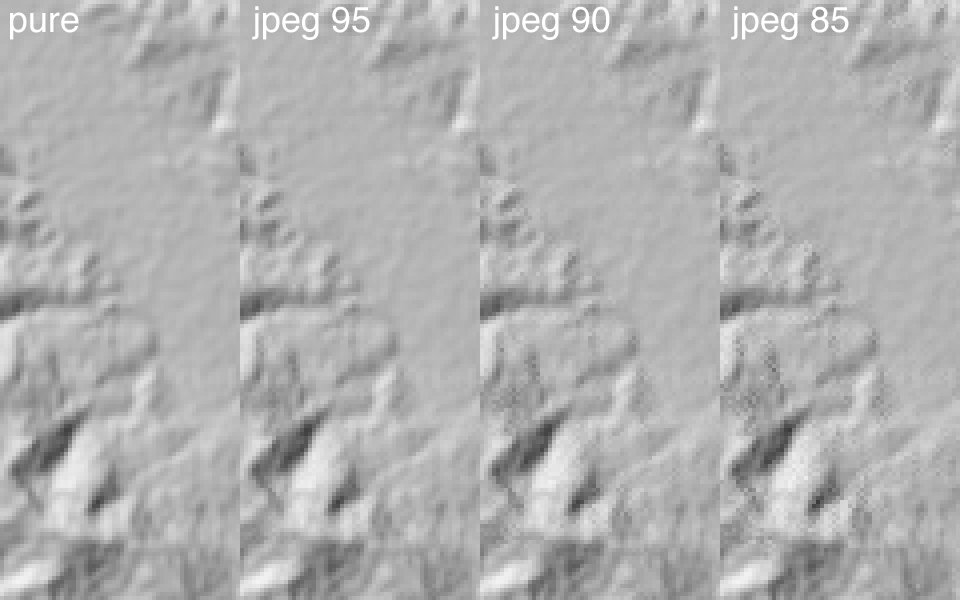
Check out read_slope_aspect() and save_slope_aspect() in the DEM-Tools code if this sounds interesting.
Anyway.
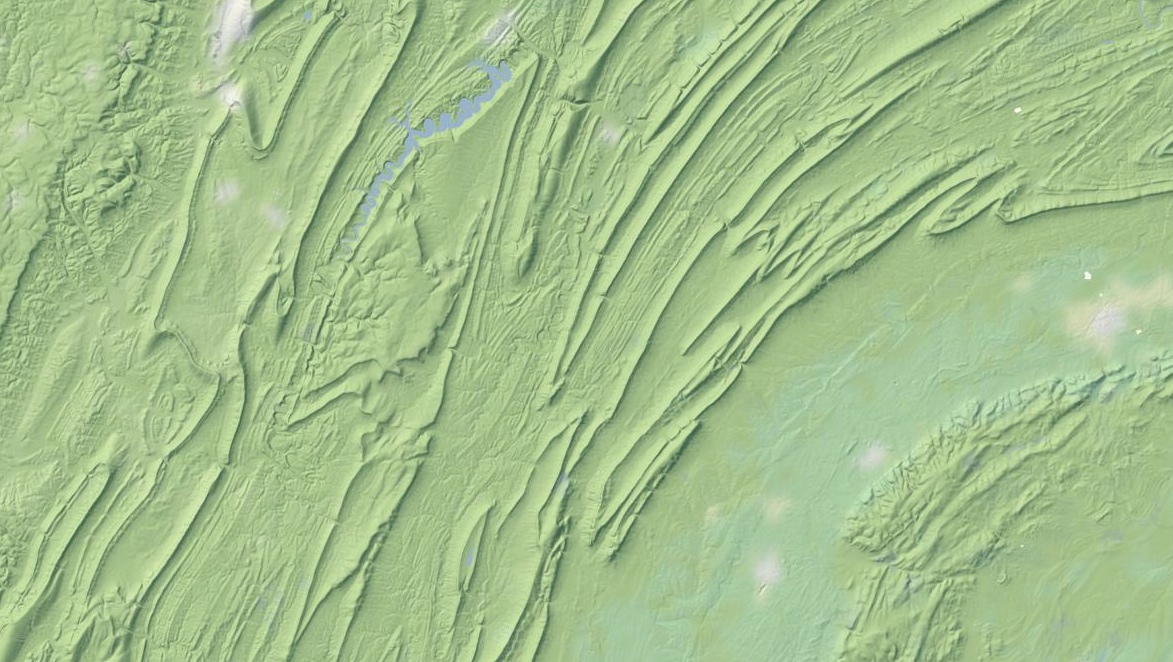
I particularly like the appearance of the layer in places like Pennsylvania’s ridge-and-valley Appalachians, with its sharp ridges and long smooth transitions. At this zoom level, you can still see the base green of the forested landscape:
Further out west, here’s part of the Grand Canyon in all its Haeckelian glory:
Use the tiles and tell me what you think. In a few weeks, if all goes according to plan, there’ll be a layer just like this one with all the OpenStreetMap goodness in the foreground.
subscribe to ![]() this site.
|
contact Michal Migurski
this site.
|
contact Michal Migurski
Comments (13)
Beautiful.
Posted by Tom Taylor on Monday, December 5 2011 8:30am UTC
hooOOOOOooooOOOoooOOOoooooray!
Posted by sha on Monday, December 5 2011 8:31am UTC
Really nice! I can spend an hour just panning/zooming in and out. I did notice some terrain artifacts. My guess is that these are edges of the elevation tile. http://flic.kr/p/aQHDNz
Posted by maning on Monday, December 5 2011 8:37am UTC
Lovely work, Mike.
Posted by Paul Smith on Monday, December 5 2011 11:06am UTC
That is gorgeous! I noticed some lines, eg in tile http://tile.stamen.com/terrain-background/12/671/1550.jpg Probably from the data but since it could be a rendering bug I thought I'd mention them.
Posted by Hannes on Monday, December 5 2011 3:43pm UTC
Gorgeous work - I loaded the tiles into GeoCommons and added your Acetate layer on top. Not as complimentary as the road and poi cartography you had in the last post but makes for an interesting toned down preview. Layer http://geocommons.com/overlays/184372 Map http://geocommons.com/maps/122869 Is the choropleth indicative of a vegetation color ramp and hill shading shows elevation?
Posted by Sean Gorman on Monday, December 5 2011 3:59pm UTC
Duh - never mind skipped the paragraph on the "National Atlas 1km land cover" for the color ramp. Pretty picture fixation...
Posted by Sean Gorman on Monday, December 5 2011 4:06pm UTC
Heh, thanks Sean - they are based on vegetation, as you've seen. Hannes, maning: the lines are due to something in the elevation data, but I'm not sure what. The one-degree files from USGS do include a bit overlap so I don't think this is due to a processing error. I think it's possible these lines are in the original data - I'll need to check around that tile to find out. Maning, where did your image come from? (lat/lon) Paul, Sha, Tom: thanks. =)
Posted by Michal Migurski on Monday, December 5 2011 6:14pm UTC
Here's another example of the "lines" problem I believe: http://tile.stamen.com/terrain-background/14/2624/5719.jpg This would be near Seattle's Gas Works park: lat: 47.645376° long: -122.335405° Hope that helps...
Posted by Shawn Medero on Tuesday, December 6 2011 4:47pm UTC
These tiles look great. Would you consider allowing Silverlight based web requests to your tile server? To do so, you would need to add a file called clientaccesspolicy.xml to the domain root. check out http://tile.openstreetmap.org/clientaccesspolicy.xml for an example. i want to try these tiles out as a background for this Silverlight map control, example here: http://samples.infragistics.com/sldv/RunSamples.aspx?cn=geographic-map#/geographic-map/gallery-contour-line-series
Posted by David Negley on Tuesday, December 6 2011 9:12pm UTC
David, that's a great idea. I'll do the same for Flash with a crossdomain file.
Posted by Michal Migurski on Wednesday, December 7 2011 6:36pm UTC
Wow! Those are amazing and utterly gorgeous!
Posted by Benjamin Golder on Wednesday, December 7 2011 10:53pm UTC
Michal, Thanks for those great looking tiles, I'm trying to build an off line map application for android for my MTB activities and those activities are in Mexico, so, want to create those nice tile maps for Mexico, I've reading the articles you publish and have read a lot of information about GIS tools inspired by your maps but I'm still lost, I'm a sw developer so, will you be able to give me some general directions on how to create similar maps for Mexico?
Posted by Carlos on Thursday, February 2 2012 1:25am UTC
Sorry, no new comments on old posts.