tecznotes
Michal Migurski's notebook, listening post, and soapbox. Subscribe to ![]() this blog.
Check out the rest of my site as well.
this blog.
Check out the rest of my site as well.
Nov 27, 2011 6:51am
OSM terrain layer
I’ve been working on a new OpenStreetMap base map, using recent experiments in vector processing and elevation rendering, and modeled on some of the characteristics of Google’s terrain layer. There are screen shots here, and an actual tile layer Real Soon Now.
Many months ago Nelson Minar prodded me to think about an open-source alternative to the Big G’s terrain map, and after some initial experiments with hill shading based on an old post of mine from three years ago, I started working on a more extensible set of stylesheets and TileStache layers.
It usually doesn’t take long for me to overthink a project, so this simple task turned into kind of a behemoth that’s I’m just managing to bring in for a landing now. Among other distractions, this project has been a vehicle to think about bringing the techniques of manual cartography to an automated workflow, the role of a basemap in non-navigational contexts on the web, and hopefully the possibility of a single cartography that can coexist on laptop screens and high-res iPhone displays. Google’s terrain layer has become a popular background map due to its relative calm compared to the electric kool-aid acid zest of Google’s road cartography, why not a similar product for OpenStreetMap and build completely from open sources?
(all images are links to large versions)
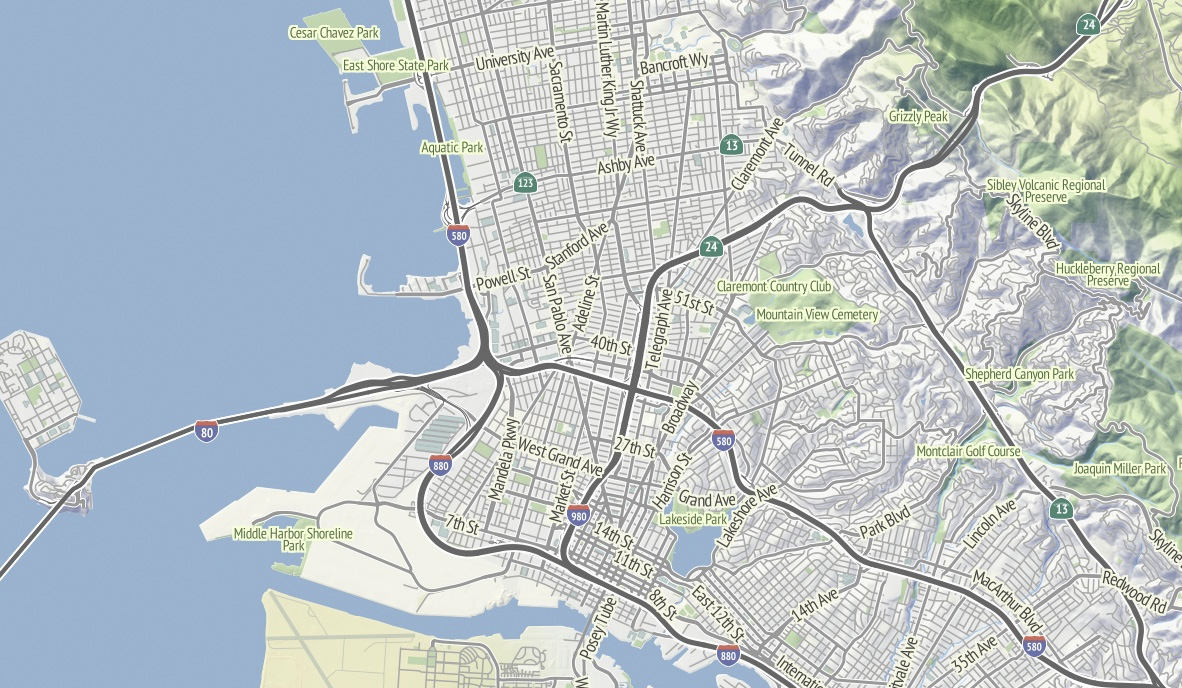
The image above includes a few details worth calling out:
- There are non-generic shields on the highways.
- The labels on the big, main dual-carriageway roads aren’t doubled-up as they often are in OSM-driven automated map labeling.
- The hill highlights are warm and yellow, the shadows are cool and blue.
- The ground is colored according to land cover, which means that the urban parts are cold and gray like concrete while further up in the hills you start to see browns and greens.
The shields and labels are both driven by some work I’ve been doing with Schuyler Erle on Skeletron. It’s an attempt to generalize complex linework in code using a range of techniques from the straight skeleton to Voronoi tesselation. I’ll write more about that in a later post, but it’s been kind of a multi-year adventure getting past my visceral distaste for the way that doubled-up “Market St.Market St.” labels tend to show up in renderings of OpenStreetMap data. I’ll follow up with another post specifically about the roads and highways.
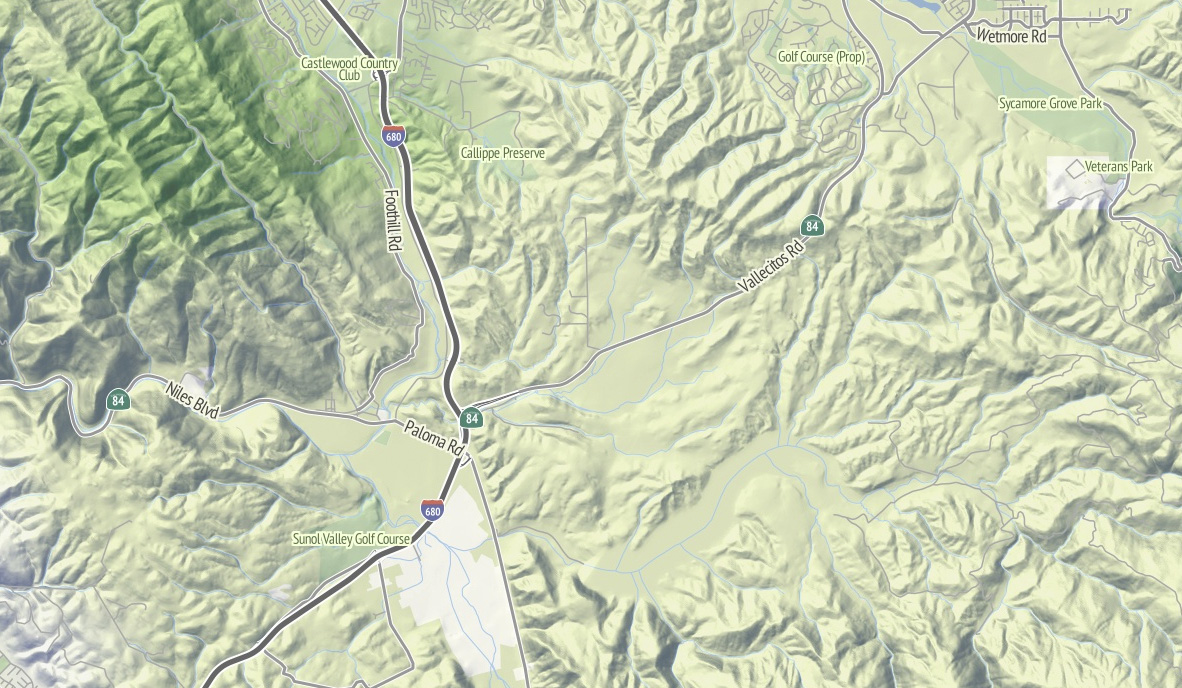
The ground and hill renderings are about imitating the work of Eduard Imhof, whose use of color derived from grayscale relief simulated the appearance of hills in sunlight. My version is drastically toned-down from his, but the hint of warm and cool are there. I’ve been using the TileStache Composite provider as a vehicle for these experiments, mostly with the aim of a tile-based mini-Photoshop for performing specific composition effects inspired by Lars Ahlzen’s TopOSM.

The colors are built on the National Atlas 1km land cover data set, and Gem Spear developed a color palette for each class of land cover from forest to tundra. The colors change in appearance as you zoom in and out: they are closest to our starting point when you’re zoomed furthest-out and fade out slightly as you zoom in to make streets and other features more legible in the foreground. Bill Mill provided a very timely patch to TileStache to make this behavior easy.
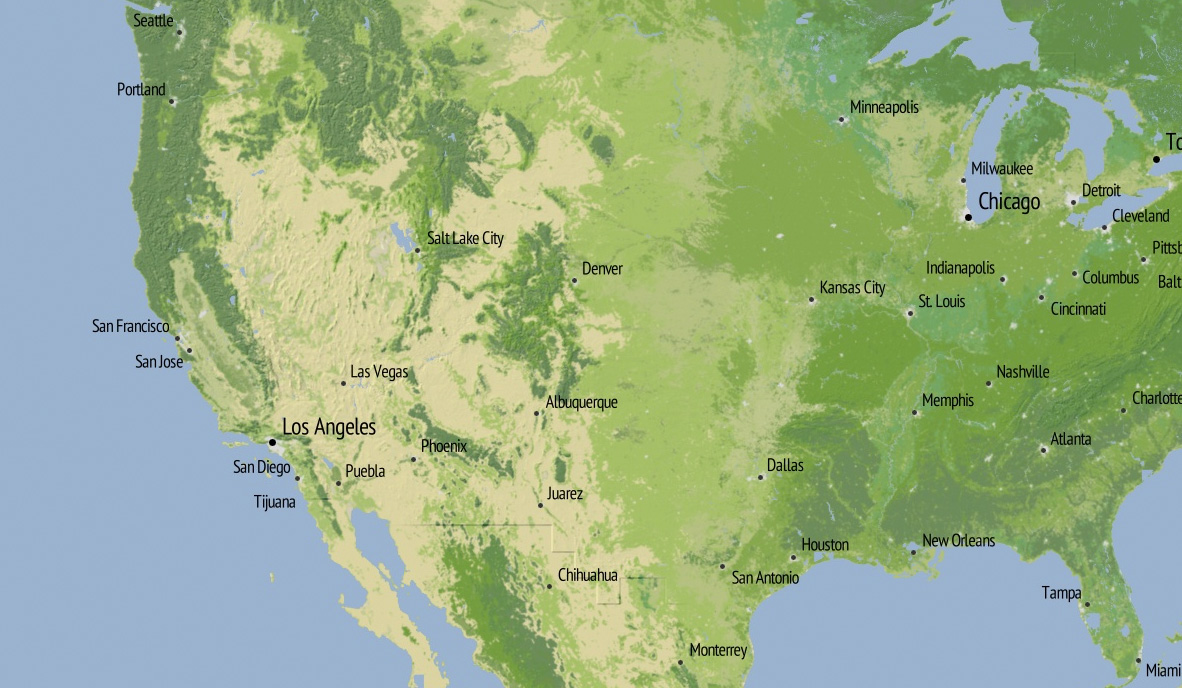
When you zoom out completely, you see a selection of cities visually organized to leave the text big and legible. The placement is driven by an update to the simulated annealing code we wrote for GeoIQ’s Acetate last year, and I’ve used the tall and narrow PT Sans font recommended by Ian Hex in his excellent article on UI typefaces.
There are still gobs of work left to do, including labels for water, schools and buildings, state and national borders at all zoom levels, and publishing actual tiles that you can use in your own projects (soon!). The various bits of code that actually do the lifting are mostly available via Git: Skeletron, TileStache, DEM-Tools, HighRoad, and Dymo.
subscribe to ![]() this site.
|
contact Michal Migurski
this site.
|
contact Michal Migurski
Comments (10)
Have you've tried using Imhoff's label placement positions (http://www.lojic.org/techhelp/pdfs/Positioning_Names_on_Maps.pdf) in conjunction with simulated annealing to improve automated labeling?
Posted by sophia on Sunday, November 27 2011 11:37am UTC
Sophia - I haven't. I've been cribbing from Steven Wouderberg’s October 2007 presentation on simulated annealing for label placement (http://www.cs.uu.nl/docs/vakken/gd/steven2.pdf) because the Imhof positions are pretty daunting to implement. Do you know of any references on automated ways of achieving those results?
Posted by Michal Migurski on Sunday, November 27 2011 6:09pm UTC
I wrote a simulated annealing labeling package using Imhoff's labeling positions in Avenue (the old ArcView macro language) about 13 years ago, Unfortunately, the source is long gone and what remains is an abstract (http://web.archive.org/web/19990203103017/http://www.gislis.org/abstracts/ozuna.html). I was curious to see if anyone else had tried to implement Imhoff's placement rules. As always, very cool and great work.
Posted by sophia on Sunday, November 27 2011 9:47pm UTC
I'd love to see the paper if you have a way of dredging it up! Did you actually use the bits where background color e.g. land/water makes a difference to label placement? Nate Kelso suggested I add a feature to Dymo to make it accept preferred placements other than northeast, so you'll see a lot of west coast cities with their labels correctly pointing out into the ocean.
Posted by Michal Migurski on Monday, November 28 2011 6:44am UTC
This is awesome Michael! I would love to use this layer sometime in the near future. However, I think an OSM layer should differentiate itself a bit more from Google. Perhaps merge the MLRC colormap and a customized elevation ramp to make something unique and beautiful? Oh and Sophia, I could probably dig up that avenue code somewhere. I think I downloaded everything off arcScripts in 1999. :-)
Posted by Peter Black on Tuesday, November 29 2011 4:33am UTC
Thanks Peter! What's the MLRC color map?
Posted by Michal Migurski on Tuesday, November 29 2011 6:13am UTC
Michael, it's here: http://www.mrlc.gov/nlcd06_leg.php FYI, I'm working on creating a terrain tileset but if you're going to open the set and allow folks to manipulate the stylesheets, please let me know...no need to reinvent the wheel and yours looks awesome!
Posted by Peter Black on Tuesday, November 29 2011 10:50pm UTC
Peter, I will definitely open the set. I'm still adding a few features (mentioned above) but it'll all be on Github as source and online as a tileset.
Posted by Michal Migurski on Wednesday, November 30 2011 8:24am UTC
Cool Michael. Let me know if there's anything I can do to help!
Posted by Peter Black on Wednesday, November 30 2011 9:28pm UTC
Hi Mike, Definitely interested in knowing more about the straight skeleton/Voronoi tesselation techniques for labeling. I'm looking for a solution to the centerline for _bumpy_ polygons, ala Bálint Miklós‘ Scale Axis Transform (http://www.balintmiklos.com/scale-axis/scale_axis_transform_socg_2009.pdf). for labeling stream/river polygons (ala http://smathermather.wordpress.com/2011/10/18/what-is-the-center-line-of-a-complex-polygon-cont-3/ ) Steve
Posted by Stephen Mather on Thursday, December 8 2011 3:15pm UTC
Sorry, no new comments on old posts.