tecznotes
Michal Migurski's notebook, listening post, and soapbox. Subscribe to ![]() this blog.
Check out the rest of my site as well.
this blog.
Check out the rest of my site as well.
Jan 24, 2007 6:36am
spatial vision
I was recently reminded of one of my major "ah ha!" moments from my undergrad years at U.C. Berkeley.
It was in Russell De Valois' class on the biological basis of vision, and concerned Hubel and Wiesel's work on information processing in the visual system. It was one of those end-of-semester lectures where huge chunks of material from previous lessons slide around and sort of lock into place, suddenly making sense as a complete body of work. It was not the other kind of end-of-semester lecture, where animal rights activists pie your professor in class because of his past experimentation on live cats and monkeys.
The majority of the course had focused on how the eye and the primary visual cortex in the brain convert incoming light signals into higher-level information. Not quite recognizing faces or reading letters, but enough to pick out basic visual features such as edges, colors, and movement.
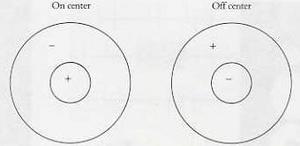
In general, the retina at the back of the eye is spotted with light-sensitive neural cells called rods and cones. Each of these cells is connected to further cells in the eye and later in the brain. Signals from each cell can excite or inhibit the cells that it's connected to: make them fire strongly, or prevent them from doing so. It turns out that simple combinations of cells in groups yield receptive fields (visual patterns) that have a center-surround shape, like this:
The left field responds positively to a bright spot of light surrounded by darkness, while the right field responds positively to a dark spot surrounded by bright light. Importantly, neither field responds much at all to large areas of unvarying brightness or darkness - detection of change turns out to be pretty much the one thing the visual system does, in varying combinations. You can imagine a group of light-sensitive cells feeding a single cell further back in the chain with a combination of positive and negative connections, maximizing the response when the exact center/surround pattern is seen.
These images show typical readings from neurons under various conditions, showing how excited they get when they see the pattern they're sensitive to:
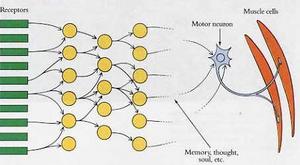
This image shows how massively-redundant and parallel connections between neurons might work to get the results above, driving input from each receptor in the retina to a growing network of visual neurons deeper in the brain:
Hubel and Wiesel's work sticking electrodes into cat brains while they (the cats) looked at moving patterns showed how specialized brain cells in the visual system are. Almost by accident, they discovered that one cell might be responsive to a short, bright horizontal line, while another might prefer a long, dark vertical stripe. Many cells also showed sensitivity to movement. A combination of delayed connections among all those neural pathways might cause a cell to respond just to a bright line moving diagonally up and to the right. The primary visual cortex in the back of your brain is full of such cells, all with a narrowly-defined job to do.
...people often complain that the analysis of every tiny part of our visual field - for all possible orientations and for dark lines, light lines, and edges - must surely require an astronomic number of cells. The answer is yes, certainly. But that fits perfectly, because an astronomic number of cells is just what the cortex has. Today we can say what the cells in this part of the brain are doing, at least in response to many simple, everyday visual stimuli. I suspect that no two striate cortical cells do exactly the same thing, because whenever a microelectrode tip succeeds in recording from two cells at a time, the two show slight differences - in exact receptive field position, directional selectivity, strength of response, or some other attribute.
The bright line drawn around all of this evidence is that this same inhibitory/excitatory structure, made of the same cells with a small variety of connections, can be responsible for a lot of selective patterns besides just dots:
- Spatially, the center-surround fields in the first image see spots.
- Connected in combinations such as long rows or areas, they see lines and edges at various orientations.
- When short delays are introduced, they see movement of spots, lines, and edges in specific directions over time.
- When limited wavelengths are taken into account, they see color in the form of red/green, green/red, yellow/blue, and blue/yellow opposites. Experiments show that people use only limited information from edges and changes to perceive color anyway.
- When signals from each eye are combined, they do basic stereoscopic vision, helping to fuse images into a coherent whole.
De Valois' work tied all of this together, and ultimately showed how all of these neural combinations weren't just detecting simple patterns, but could actually be made to compute Fourier transforms. If the center-surround structure varied in size, it could be interpreted as a spatial frequency detector, rather than just a line or dot detector. All this, in eight or so layers of dense cellular connections. The repetitiveness of neural connections is what makes this possible - calculations performed in a few milliseconds in the brain are much more expensive using computers, which must process pieces of information one at a time, in serial.


Comments
Sorry, no new comments on old posts.