tecznotes
Michal Migurski's notebook, listening post, and soapbox. Subscribe to ![]() this blog.
Check out the rest of my site as well.
this blog.
Check out the rest of my site as well.
May 8, 2008 4:56am
visual urban data slides
This is the second half of a talk that Tom Carden and I did together at U.C. Berkeley's iSchool, a few weeks ago on March 20. Tom has the first half with slides posted on his own blog. He talks about the general studio/Stamen context for our forays into visual depictions of urban data, while I go deep on Oakland Crimespotting in particular. I returned to Berkeley's Graduate School of Journalism a few weeks later to deliver a slightly-edited version of this talk alone. A video that I'm afraid to watch is on Youtube here and here.
CrimeWatch
First, it's important for us to back up a bit and understand the need that Crimespotting tries to address.
Our initial work was based on the City of Oakland's existing CrimeWatch application, a "wizard-like" form-based website available at http://gismaps.oaklandnet.com/crimewatch/. The first thing a visitor to CrimeWatch sees is a disclaimer form and a few pages of instructions.
Once past the first page, there is a long series of questions that a visitor must answer: what kind of crime to view, where to look, how far back in time to search. The crime types here seem to correspond to broadly-used categories, but there are differences among jurisdictions. For example, Oakland does not publish domestic violence as a separate category. San Francisco, which uses a similar crime mapping application, has removed homicides entirely from its online maps.
Eventually, the resulting map loads in the browser. The presentation is not entirely satisfying, with a range of tiny report icons overlaid on a map and frequently obscured by information detail windows.
Parsing Images
This is the technically difficult part. The second of the two images above shows our original data input: a compressed image covered with small, graphic icons.
We used Python Imaging Library and a collection of scraping tools to search for instances of known icons and convert them to rough GPS positions.
Because we knew what we were looking for (e.g. Vehicle Theft, Prostitution, Narcotics, Robbery, Vandalism shown here) it was possible to search by shape and color to come up with positions for these icons on CrimeWatch maps.
Early this year, Oakland City IT opened up a reliable, text-based feed of crime information for us. This was a huge help, and we no longer need to go through the slow image-scraping process detailed above. Just before IT made a better source of data available to us, we were putting the finishing touches on a Mozilla browser plug-in for distributed scraping, which introduced an element of human sanity-checking after each sweep.
Permanent Links
All of the data we collect is available in a non-mapped, text form. Everything is shown on a map, but it's also possible to slice and dice the data to show reports of a certain type or from a certain date, listed out.
The single most important improvement we think Crimespotting introduced to Oakland is the concept of a permanent link for every reported crime. These permalinks contain isolated maps of the event, connected reports, a place for people to leave comments, and other reports from the same area and time.
Patterns
Street crime in Oakland really only happens between the 880 and 13 freeways. South and west of 880 is industrial, while north and east of 13 is hilly, suburban, and quite affluent. Property crimes (marked in green) happen all over, but violent crime (marked in red) is further constrained to the poorer parts of town below 580.
We've noticed that prostitution arrests seem to come in waves - long stretches of no activity, followed by rapid bursts along San Pablo Boulevard in West Oakland or International Boulevard in East Oakland. Above we can see the result of a string of busts along International in the Fruitvale area shown in blue, the color we use for quality of life crimes like drugs, alcohol, or disturbing the peace.
Although West Oakland is commonly thought to be a dangerous place, the data we've seen shows that violent crime is really spread evenly between West Oakland and downtown. There's no cluster of violence to the West, but there is a sharp cluster of drug activity (in blue) between 580 and San Pablo.
One important lesson we learned from our users: police beats are more important than we thought. This is a map of reports from beat 04X. The beat number system is how citizens interact with the police department, and what we assumed was an arcane administrative detail is really a living, breathing idea. Not so with "police service areas" or city council districts.
Outcomes
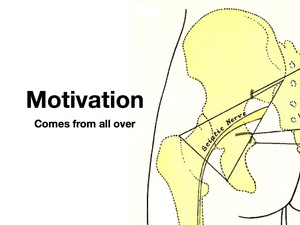
Really, the most important thing we've learned is that motivation can come from everywhere. I initially started this project because I had hurt my back in late 2006, and had a bunch of free time on my hands over that winter. What started as a technical curiosity became a studio project and eventually a public website. Motivation comes from all over, give people data and they'll figure out something interesting to do with it.
Just showing crime is relentlessly negative, and seems to really draw out the kind of graffiti-squad neighborhood busybodies who focus solely on little problems. A near-universal reaction from non-residents to this particular project has been relief that they don't live in Oakland, but it's really not that bad here. It just looks bad when all you show is crime. We'd like to map other things: city services (police, fire, emergency), tax parcels, effects of policy, other administrative information that's hugely important.
We're also thinking about how to fill in the tapestry around Oakland - currently we're covering a very small, narrowly-defined area.
On the bright side, we're using our projects to test the assumption that there's something interesting going on with city data. Decreasing costs (money, complexity) of data analysis techniques (e.g. Google's new visualization kit) drive demand for available data.
We think in the very near future, it will become cheaper for cities to publish raw data and let citizens do their own analysis with IT in a support/enabling/superhero role. Our argument is not about "democratizing" anything and the political baggage that rides along with such terminology, it's about responding to changing costs.


Comments
Sorry, no new comments on old posts.