tecznotes
Michal Migurski's notebook, listening post, and soapbox. Subscribe to ![]() this blog.
Check out the rest of my site as well.
this blog.
Check out the rest of my site as well.
Aug 30, 2008 5:22am
cascadenik: cascading sheets of style for mapnik
Style sheets were available in electronic publishing systems from around 1980 (see Chapter 2 and 3). Combined with structured documents, style sheets offered late binding (Reid 1989) of content and presentation where the content and the presentation are combined after the authoring is complete. This idea was attractive to publishers for two reasons. First, a consistent style could be achieved across a range of publications. Second, the author did not have to worry about the presentation of the publication but could concentrate on the content.
(Hakon Wium Lie, Cascading Style Sheets)
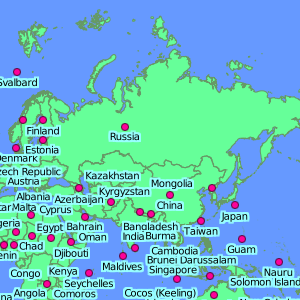
Mapnik, the open source map rendering library I've written about recently, uses an XML language similar in spirit to SLD for applying visual style to map vector data.
It's definitely tolerable, but otherwise not particularly good.
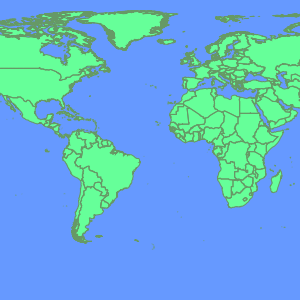
Having recently completed a country-wide geographic treatment of the UK for LOCOG (London Organising Committee of the Olympic Games), I've had a chance to experiment with ways to improve the state of the art in Mapnik styling. CSS, the ubiquitous format understood by all halfway-modern web browsers, offers a way forward.

I've implemented a pre-processor that accepts CSS-type stylesheets and produces traditional Mapnik stylesheets. Imagine a program that takes HTML and CSS files, sprinkles the HTML with FONT tags, and makes them viewable to Netscape 2.0 users, and you've got the idea.
Check out a brief tutorial, or grab the source code from the mapnik-utils project.
My hope here is that the characteristics of CSS that made it acceptable to designers and bumped the visual and semantic sophistication of the web will translate to the world of maps as well. Mapnik's existing styles get the job done, but are unsatisfying because they force the designer to develop and implement the kind of class-based logic that CSS makes easy. It's still early in this particular universe of concern, but the suddenly rising viability of the OpenStreetMap project is going to make map design for the web a buzzing, vibrant front in another year or two, tops.
CSS has a few properties that make it a great candidate for mapping:
- Stylesheets can live separately from the content they apply to, with many pieces of content sharing rules defined by single a source. In contrast, Mapnik's own "stylesheet" terminology refers to an XML format that blends content (the vector data that maps are made of) with appearance. This is going to be interesting as the availability of data like OpenStreetMap's creates a need for attractive CSS bases for people to work from.
- The "C" in CSS is for "Cascade", shorthand for a set of expectations governing how rules from a variety of sources can be combined. In CSS, it's possible to state the equivalent of "all text is black, but proper nouns should be highlighted with yellow." Maps present similar needs, there is often a hierarchy of feature types that need to shares some visual properties but not others: roads, toll roads, toll roads under construction, etc.
- CSS interacts with HTML largely through element types, classes and IDs. The class concept in particular makes it possible to mark content with meaningful labels, and apply visual styles based on those labels. Maps present feature classes like public buildings, various kinds of parkland, etc., yet Mapnik has no such concept of class.
- CSS clearly defines how relative addresses ought to be handled, in the case of linked files like background images. According to the CSS specs, addresses are always relative to the stylesheet in which they're used, not the content document from which the stylesheet is linked. This behavior is predictable and makes for easy centralization and re-use of visual rules. Mapnik expects that image files can be found in absolute locations, on the same computer where it's being run.
The basic improvement offered by CSS is that the linkage has been flipped around to point in the opposite direction. SLD and Mapnik both have data layers that specify how they are to be rendered via explicit connections to declarations of color, line weight, etc. It's better to do the opposite: classify data layers with meaningful categories and create separate styles that act on those categories. The style rules point to the things they apply to, e.g. "roads should be black lines, while schools should be filled in with yellow."
So far where I've gotten is a two-week-old proof of concept that generates good, clean Mapnik stylesheets. It's usable now, but there are no doubt edge cases where my handling of things like filters will need to be tweaked somewhat.
Read the quick tutorial, and grab the source code from the mapnik-utils repository.
subscribe to ![]() this site.
|
contact Michal Migurski
this site.
|
contact Michal Migurski
Comments (3)
The good news is that you can use CSS with � SVG.
Posted by karl on Monday, September 1 2008 11:07am UTC
This looks promising! About to give it a go for a simple dynamic mapnik rendering service.
Posted by Hamish on Tuesday, September 30 2008 11:12pm UTC
Thanks, Hamish - let me know if you run into any problems. I've been trying to keep an occasional eye on http://code.google.com/p/mapnik-utils/issues/list for issues that might come up.
Posted by Michal Migurski on Wednesday, October 1 2008 5:14am UTC
Sorry, no new comments on old posts.