tecznotes
Michal Migurski's notebook, listening post, and soapbox. Subscribe to ![]() this blog.
Check out the rest of my site as well.
this blog.
Check out the rest of my site as well.
Feb 26, 2012 10:57pm
tile drawer: grist for the mill
Last week, I finished up my four-part class at GAFFTA on visualizing and mapping data. For day three, I chose Mapbox’s TileMill to teach basic cartographic techniques such as choropleths and managing data from OpenStreetMap. I’d never really used TileMill in anger, and teaching the class was an excellent opportunity to apply experience with Mapnik and Cascadenik to a tool built for normal humans to use. I can report that TileMill is a champ. It’s not often that advanced nerd tools are adapted for civilian use, and the group at Development Seed have done an amazing job of packaging the Mapnik experience into a credible desktop application for easy cartography.
Meanwhile, Tile Drawer is now over two years old, and the stars are aligning for a revisit. I’ve substantially updated and modified Tile Drawer for the end times, and I’ve been retooling the creation process to address two questions that TileMill raises: how do you get data from OpenStreetMap in to begin with, and then what do you do with your tiles when you’re done? MapBox answers the second question with their various hosting plans, but what if you want to serve maps for areas larger than a single MBTiles files can handle or you simply want to be ready for the kinds of futures envisioned by Maciej Cegłowski or Aaron Cope?
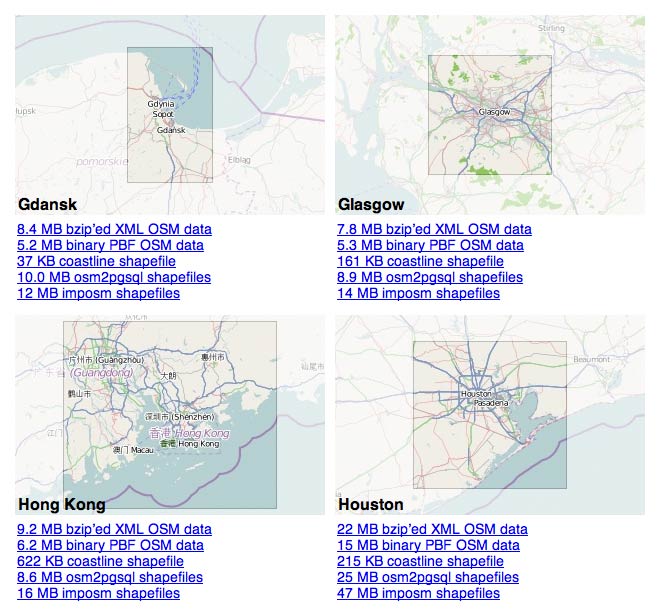
I’ve been slowly and quietly answering the first question by building up shapefile exports for my Metropolitan Extracts service, and I’m happy to announce that it now includes Imposm and Osm2pgsql shapefiles for every extracted area. Oliver Tonnhofer’s Imposm is particularly well-suited to use in Tilemill, with its thematic division of OSM data into thematic layers.
If you want to use OSM data in Tilemill, and you’re interested in one of the 130+ extended metropolitan areas I’ve been supporting in the Metro Extracts, then you should be good to go with the zip files available there.
Now, about that second question.
I’ve generated collections of data in specially-named shapefiles for four sample metro areas:
- San Francisco (just osm2pgsql, just imposm)
- London (just osm2pgsql, just imposm)
- Berlin (just osm2pgsql, just imposm)
- Tokyo (just osm2pgsql, just imposm)
If you use these files with their names unchanged in TileMill and supply a zip file of your exported Mapnik 2.0 XML stylesheet to Tile Drawer, it will be able to figure out what PostGIS tables you might mean and render a map accordingly. If you want a map layer for all of Texas, it would probably take too long to render the entire set of tiles using TileMill and too long to upload it all to MapBox. Instead, you can start with a sample city above, create a custom cartographic treatment in TileMill, and then provide Tile Drawer with a bounding box for the entire state and a copy of your stylesheet. I’ll be documenting this process on the site soon for more information.
Looping back around, Tile Drawer is useful for TileMill even if you plan to use Mapbox for hosting. One of the last things that Tile Drawer does after importing a data extract is to generate the same collection of Osm2pgsql and Imposm shapefiles available in the sample selections above, so you can prepare data for your own use by setting up an instance of Tile Drawer, waiting for it to finish importing data from OpenStreetMap, and then downloading one of the osm-shapefiles zip files found in /usr/local/tiledrawer/progress.

Comments
Sorry, no new comments on old posts.