tecznotes
Michal Migurski's notebook, listening post, and soapbox. Subscribe to ![]() this blog.
Check out the rest of my site as well.
this blog.
Check out the rest of my site as well.
Apr 14, 2005 7:05am
splines
I've been doing a lot of research on spline curves lately, for a soon-to-be-announced project that requires moderately sophisticated rendering techniques not normally available in flash. This project has two requirements: drawing a smooth line through a series of points on a map, and varying the thickness of the line to convey information.
(see this in motion, see how it was made)
For those not familiar with graphics software such as Adobe Illustrator, splines are curves whose shape can be controlled by points. The curve travels through anchor points, while control points are used to influence the shape of the line. Here's an example, with anchor points shown as open blue circles and control points shown as filled blue dots:

The word spline comes from a term used in shipbuilding:
Because of their great size, such drawings were often done in the loft area of a large building, by a specialist known as a loftsman. To aid in the task, the loftsman would employ long, thin, flexible strips of wood, plastic, or metal, called splines. The splines were held in place with lead weights, called ducks because of their resemblance to the feathered creature of the same name. (Philip J. Schneider, NURB Curves: A Guide for the Uninitiated
The Flash MX drawing API provides a function called curveTo(), but it's based on a simpler type of spline curve called a quadratic curve. The splines used in Illustrator are cubic curves. The difference has to do with the number of control points that determine a curve: more control points means better control over the curvature of the line. Fewer control points means simpler math, crucial for an animation program such as Flash. Timothee Groleau has an excellent article, Approximating Cubic Bezier Curves in Flash MX, which shows a few strategies for "faking" cubic curves using Flash's simpler quadratic curves. The advice boils down to chopping up cubic curves into short quadratic curves that are close enough in appearance to fool the eye.
The math involved in drawing cubic curves is actually a lot less hairy than it looks. The easiest way to think about it is to imagine a point moving through space, pulled towards the control points over time. In those equations, t refers to the position of the point in time, from 0 to 1. x(t) and y(t) are two functions that give the x, y position of that point in space at time t. Drawing curves is difficult, drawing lots and lots of straight lines that are short enough to look like curves is easier. If you thin-slice t, you draw many segments and get a prettier curve. If you increment t by a larger amount, you draw fewer segments for a blockier curve, but it's a faster process.
In my case, I had a series of known anchor points, and had to guess good positions for control points. I did this by looking at neighboring anchor points. For example, when drawing the segment B-C of a longer line A-B-C-D, the position of the control point attached to B is based on the angle between A and C, while the position of the control point attached to C is based on the angle between B and D. This way, the line can be "stitched" together, with a smoothly-varying curvature over its length. A is influenced by B and C, B is influenced by A, C and D, etc.
Rendering variable thickness is more difficult. Taking the derivatives of x(t) and y(t) gives you a vector showing the current direction of the line. Using a bit of cartesian/polar conversion, it's possible to find the positions of points perpendicular to that tangent, which are to the sides of the line. Varying the distance of these points gets you two additional "rails" alongside the central curve. When traced, these rails follow the curve closely. Interesting things happen when the width of the whole thing is greater than the diameter of a hairpin turn.
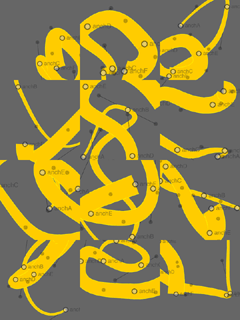
This flash file shows my progress so far. The open circular points are placed randomly. The positions of the black control points are guessed, and the yellow line is drawn based on these values with a smoothly-varying thickness over its length. The whole thing is interactive, so you can get a feel for the behavior of the path as the control and anchor points are moved about. Here is the actionscript source.

Comments
Sorry, no new comments on old posts.