tecznotes
Michal Migurski's notebook, listening post, and soapbox. Subscribe to ![]() this blog.
Check out the rest of my site as well.
this blog.
Check out the rest of my site as well.
Jun 21, 2015 10:31pm
state of the map 2015
Two weeks ago I was in New York for State Of The Map 2015, the annual OpenStreetMap conference.
2014’s event was in DC, and I had kind of a hard time with it. Good event, but dispiriting to come back to the community after a year away and encountering all the same arguments and buillshit as 2013 and before.
This year in New York was awesome, though. It felt as though some kind of logjam had been cleared in the collective consciousness of OpenStreetMap. Kathleen Danielson, new international board member, delivered a mic-drop talk on diversity. New York designers and urbanists were in attendance. A wider variety of companies than ever before sponsored and presented.
I was a last-minute addition to the program, invited by Brett Camper to take over moderation of his panel on vector rendering. There is video now on the website (here is a direct Youtube link for when the permalink-haters who do the site each year break all the current URLs).
We had four participnts on the panel.
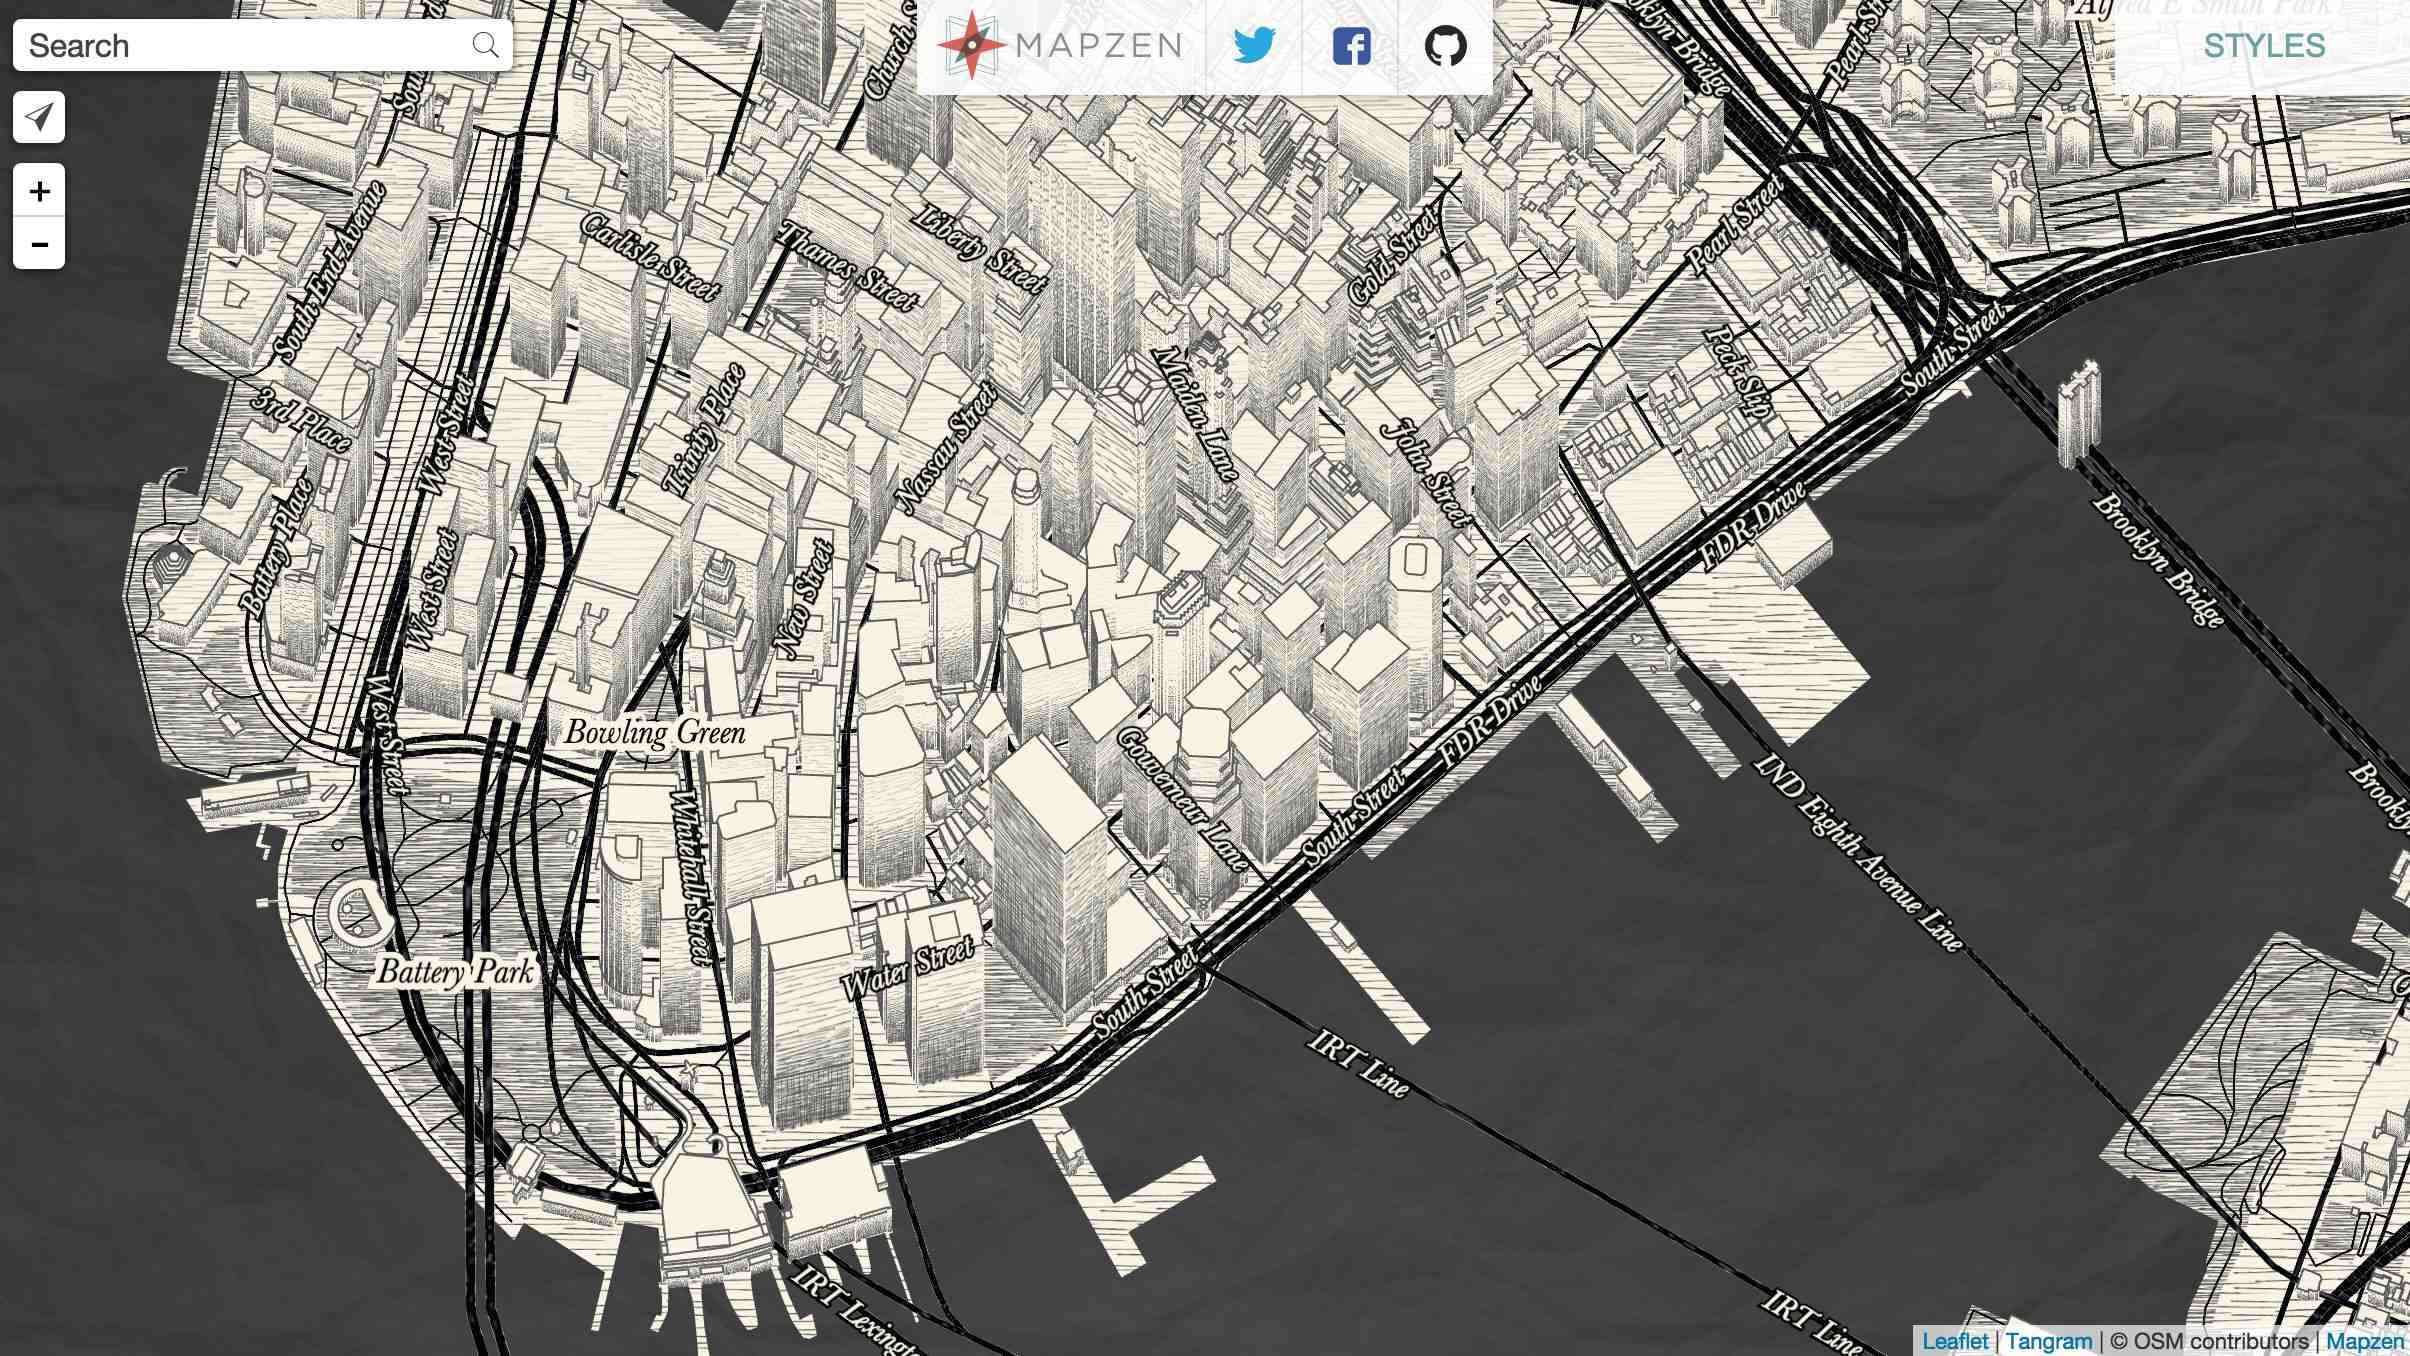
Matt Blair from Mapzen works on the Tangram rendering engine, a WebGL rendering layer for in-browser delivery of responsive, dynamic, and funny maps like this sketchy style:
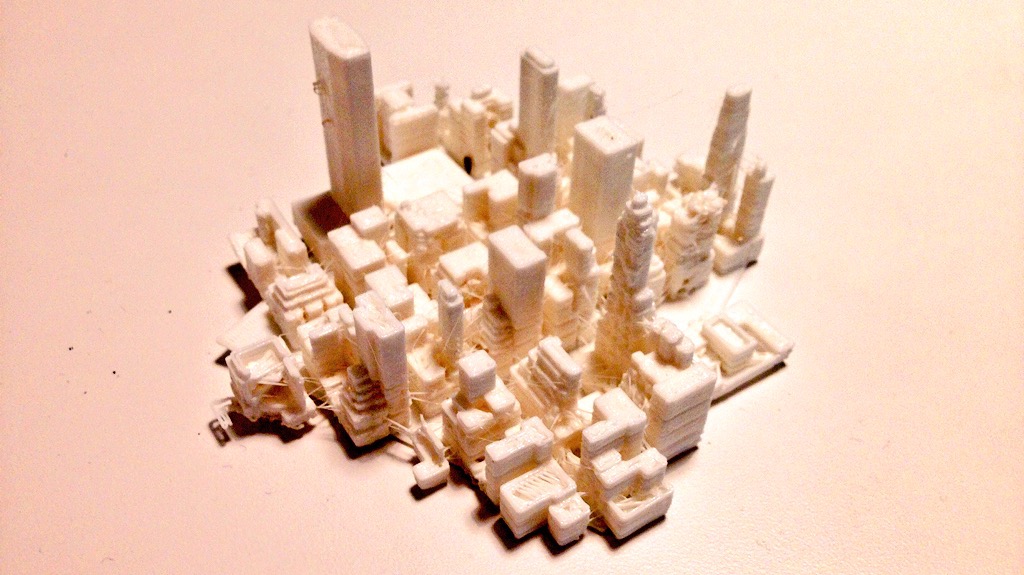
Mapzen has been doing a bunch of interesting things with 3D, and when I visited the office Peter Richardson had a bunch of printed Manhattan tiles on his desk, including this one of 16/19300/24630 with Grand Central and the NYPL viewed from the north:
Konstantin Käfer from Mapbox works on the new GL rendering product, and he’s been producing a regular stream of new rendering work and data format output throughout the three years I’ve known him. Konstantin shared this gorgeous animated view of a map zooming from Boston to Melbourne, showing off dynamic text rendering and frame-by-frame adjustments:

Hannes Janetzek of OpenScienceMap produces a rendering product intended for scientific use. His work is used to support academic research, and he was unique on the panel for not having a commercial product on offer: “OpenScienceMap is a platform to enable researchers to implement their ideas, to cooperate with others, and to share their results.”
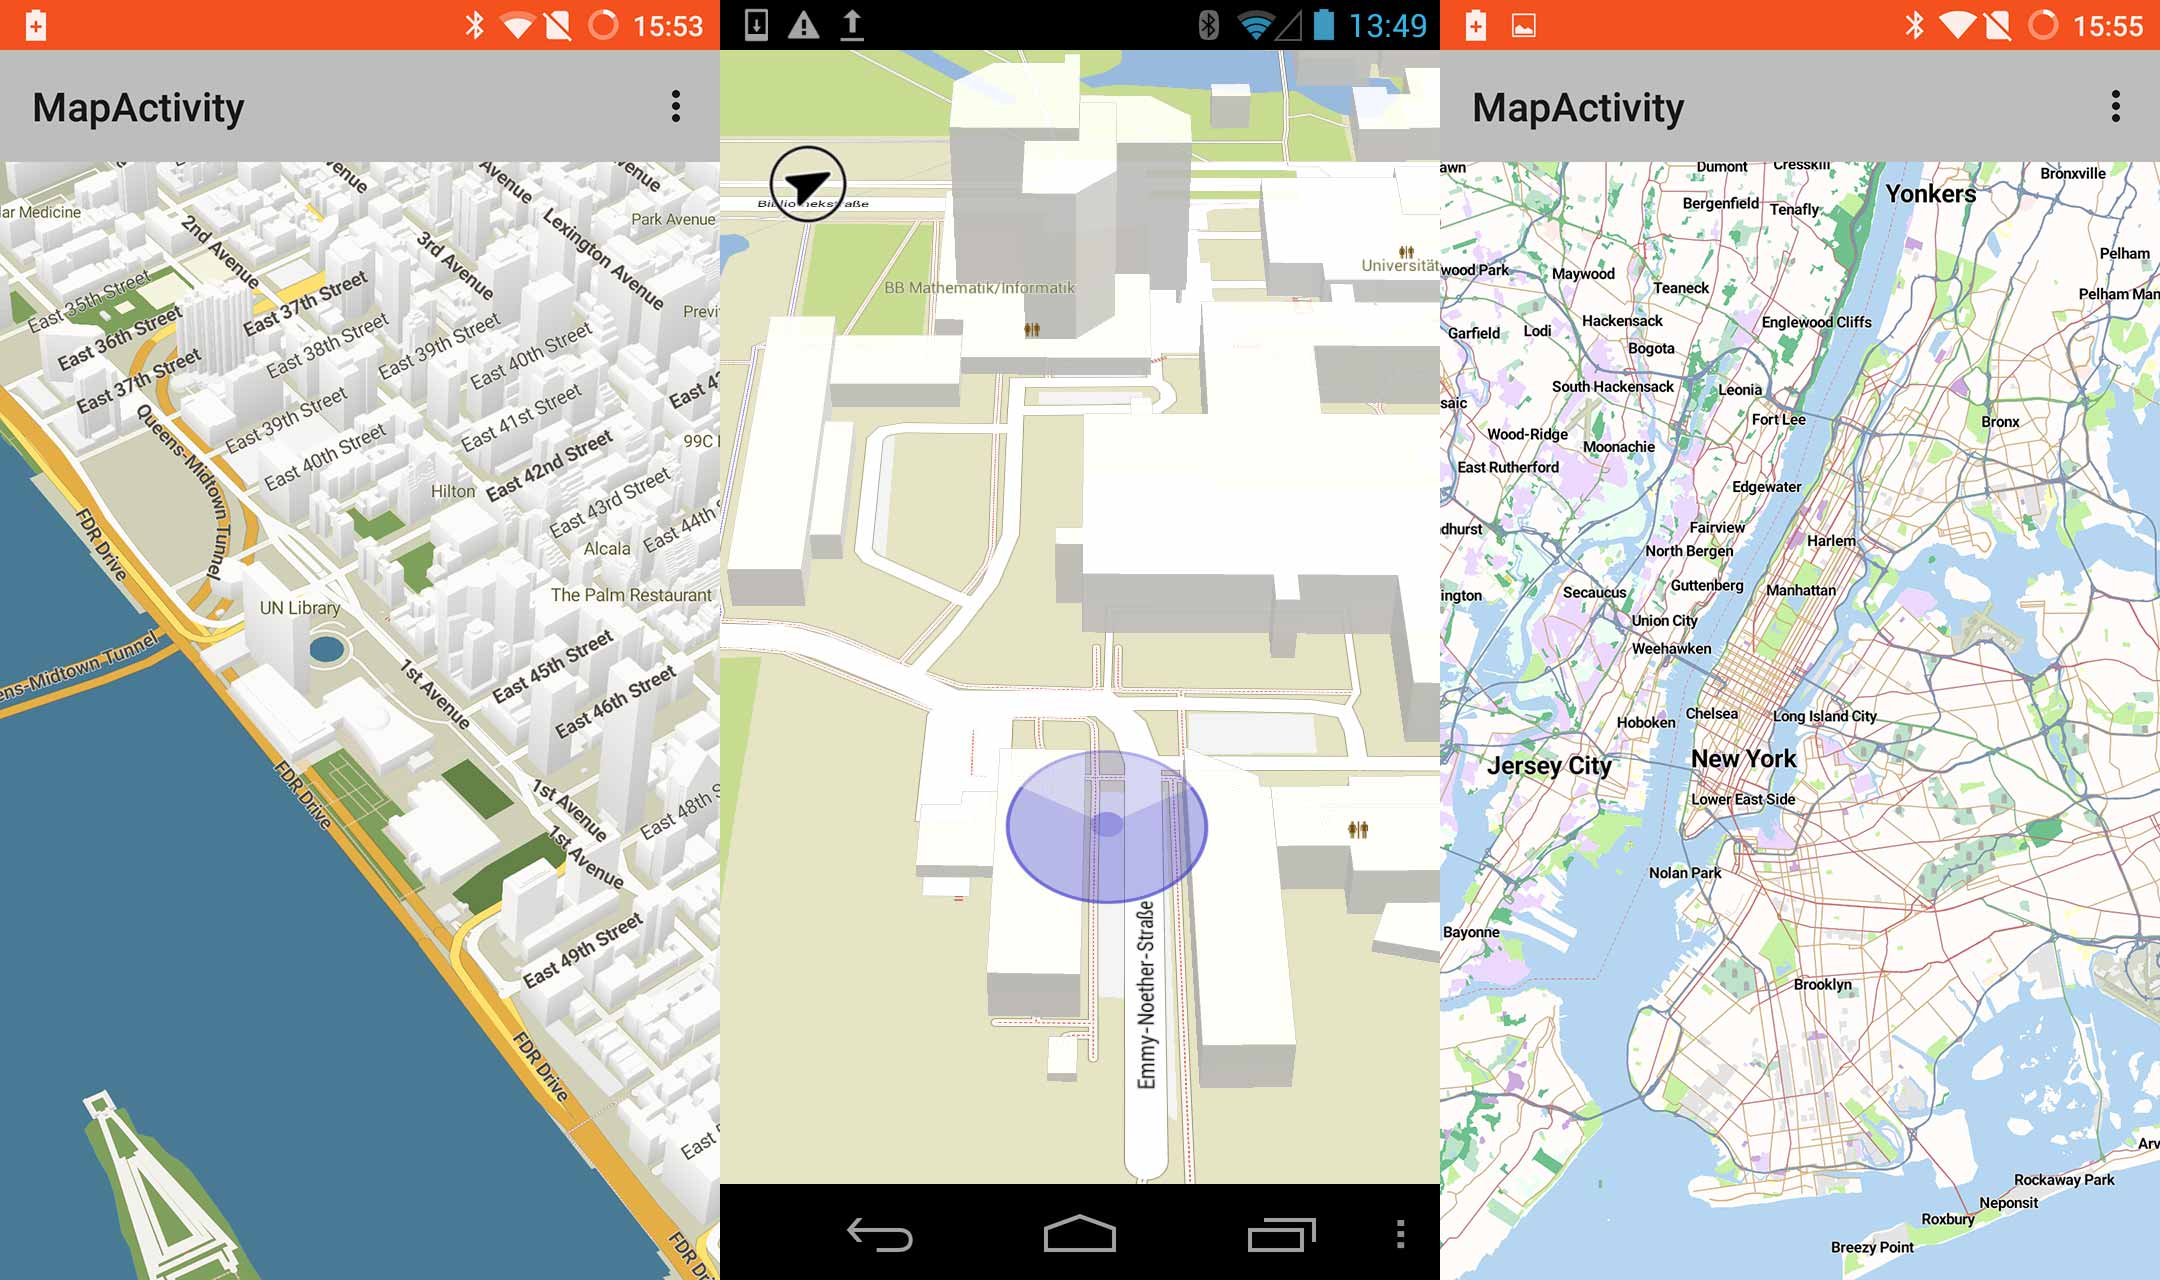
Steve Gifford of WhirlyGlobe-Maply is primarily in the consulting business, and his open source 3D globe rendering platform is used by the current number two app in the Apple app store, Dark Sky. The rendering output of Steve’s work is typically different from the other three, in that he’s mostly delivering zoomed-out views of entire regions rather than the street-level focus of OpenScienceMap, Mapzen, and Mapbox. It was telling that everyone except Steve identified text rendering and labeling as their primary difficulty in delivering vector-driven client-side renders.
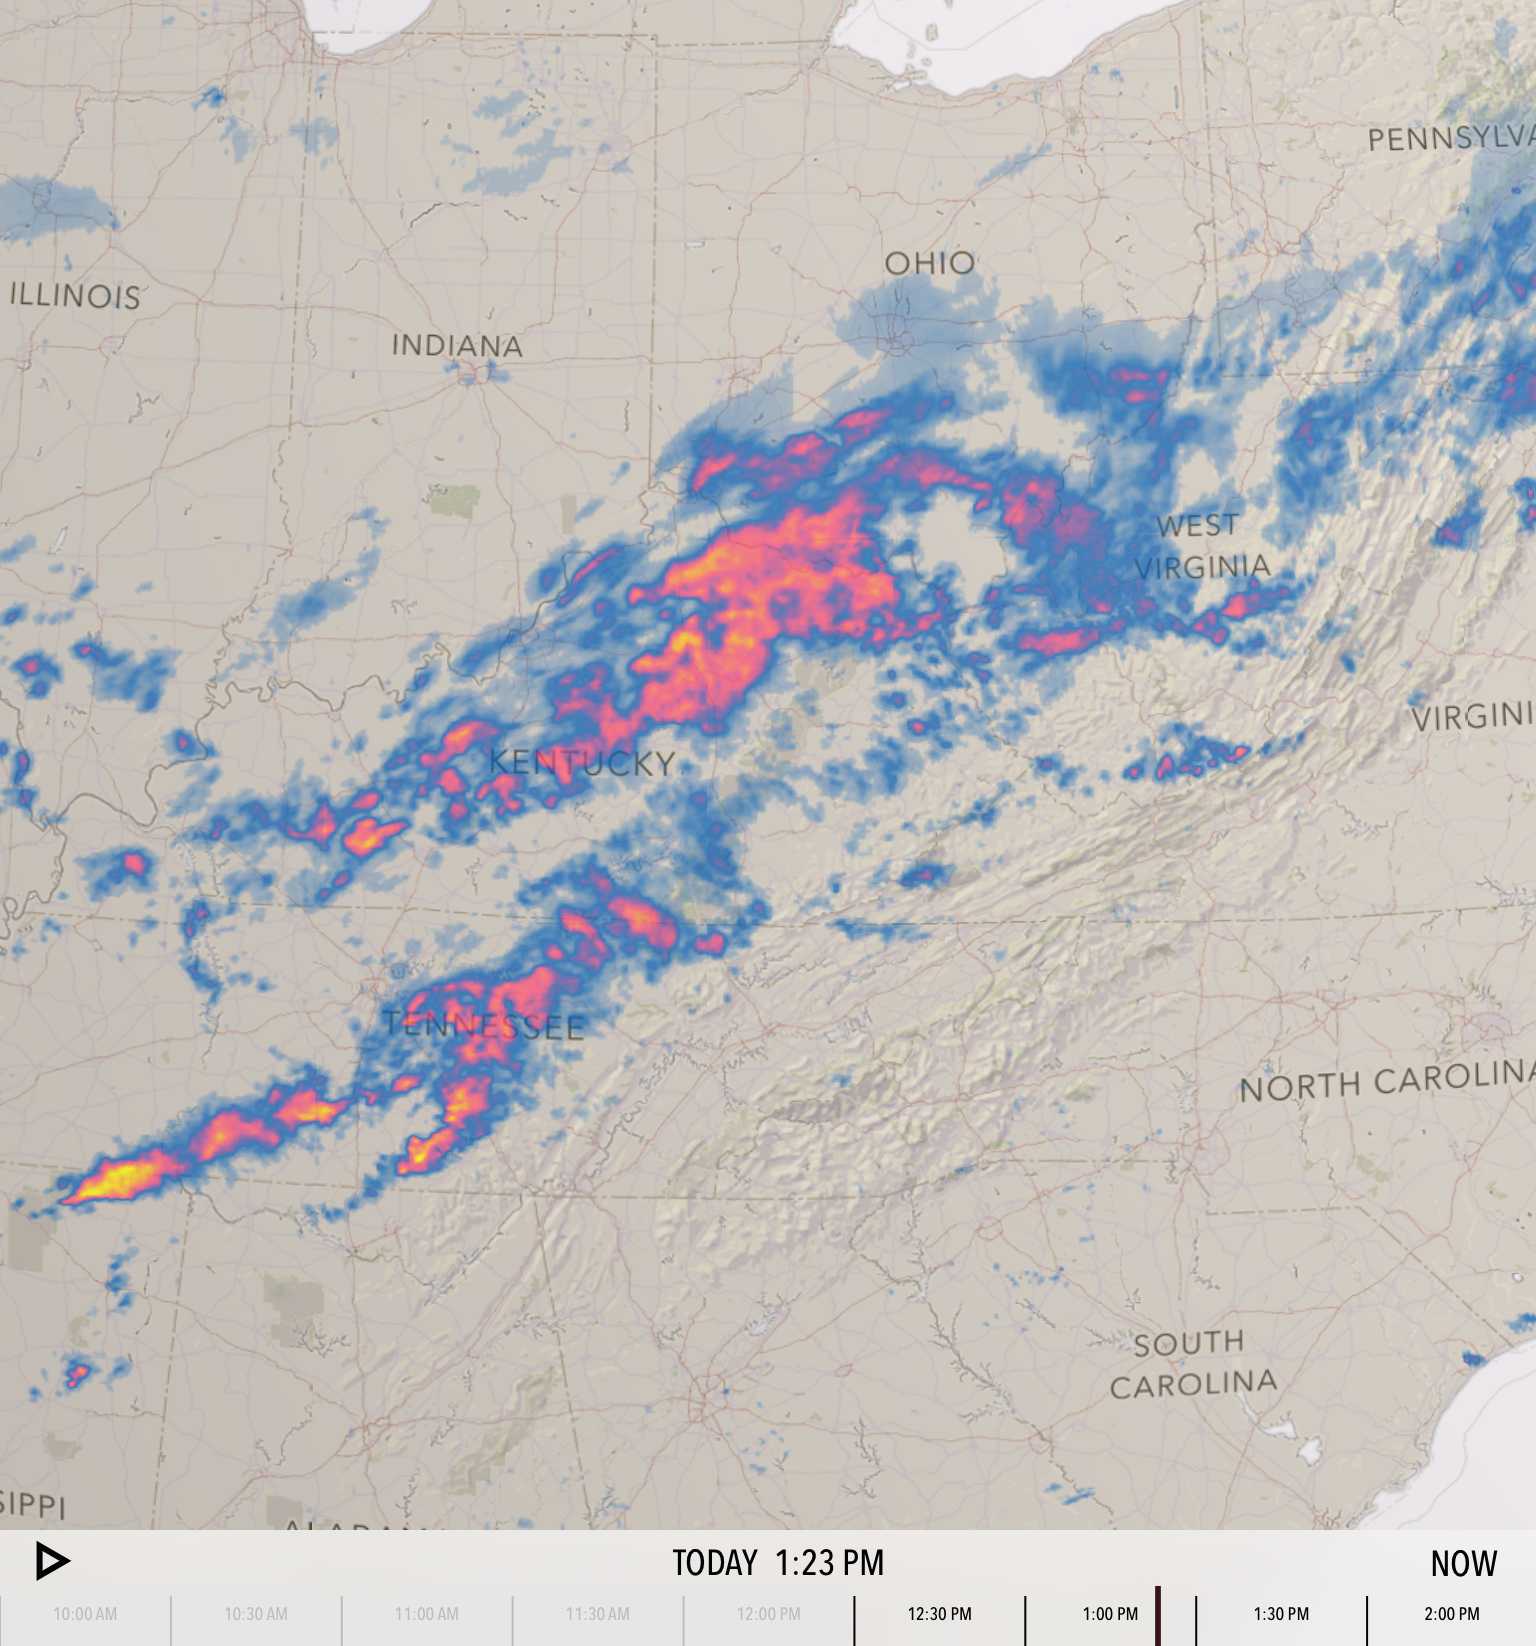
Steve’s rendering pipelines commonly cover more raster rendering than the others, such as this screen from Dark Sky showing stormy weather over Ohio and Kentucky:
I produced a bunch of vector rendering work two years after I left Stamen, and I enjoyed moderating a panel on a topic I’m familiar with without having any skin in the game. It’s super exciting to see all of this happening now, and it feels a bit like OSM raster rendering in 2006/07, when Mapnik was still impossible to install but a growing group of people like Dane were nudging it forward into general accessibility. I give vector tiles and vector rendering another 1-2 years before it tips from weird research and supervised, commercial deployment into wide use and hacking.
subscribe to ![]() this site.
|
contact Michal Migurski
this site.
|
contact Michal Migurski
Comments
Sorry, no new comments on old posts.