tecznotes
Michal Migurski's notebook, listening post, and soapbox. Subscribe to ![]() this blog.
Check out the rest of my site as well.
this blog.
Check out the rest of my site as well.
Apr 26, 2008 12:01am
arduino atkinson
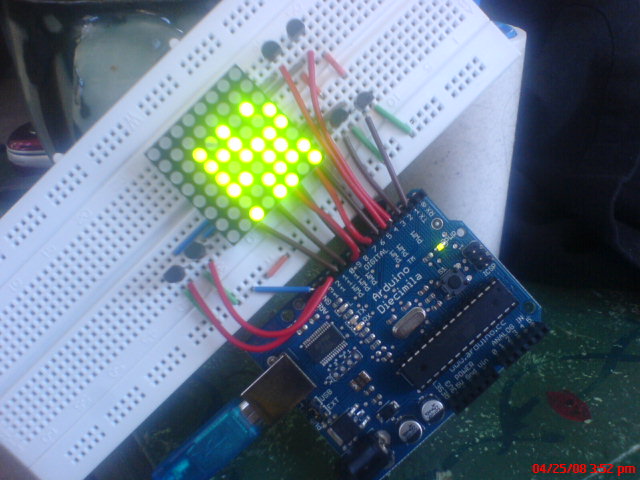
Last October I published a tiny implementation of (Bill) Atkinson dithering in Python. Aaron ran with it and created a Modest Maps filter to prepare maps for print. Now, I'm finding Atkinson dithering useful when pumping pixels through this LED matrix I bought from Sparkfun and connected to my Arduino.
This is me messing with hardware.
First off, the matrix isn't an easy thing to wire up. The datasheet provides these two diagrams:
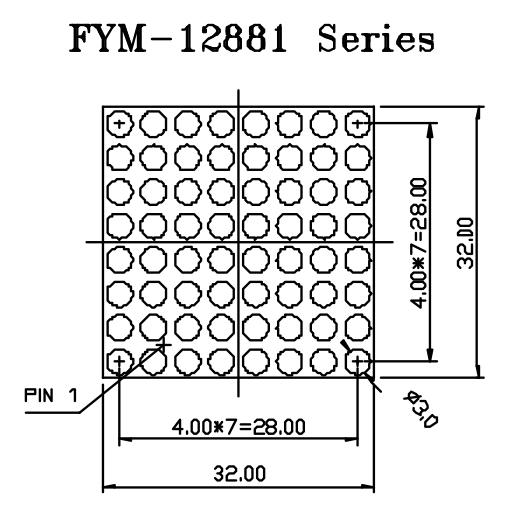

A bunch of trial-and-error showed that the pins on the matrix are ordered from #1 in the lower left, to #12 in the lower right, up to #13 in the upper right and #24 in the upper left: counter-clockwise, one pin for each row and two pins (green, red) for each column. The pins are grouped in sets of (green, red, row) across the top and bottom, with the top pins controlling the left-hand columns and upper rows, and the bottom pins controlling the right-hand columns and bottom rows. It's necessary to know which end is up, shown by the (now rubbed-off) product code printed on the bottom of the matrix component. I think a little extra effort on Foryard Optoelectronics' part would have resulted in a matrix that was radially symmetrical, and worked identically regardless of how it was pushed into the breadboard.
You connect a column and a row from power to ground, and the corresponding LED lights up. You can address one entire row or one entire column at a time, but a full 8x8 image requires you to scan from one to the next, illuminating pixels in sets of 8 hundreds of times per second.
I don't have 16 digital outputs on the Arduino, so I can only address six rows and six columns. This is enough to beging to experiment with tiny images, like the fades from all-off to all-on and back shown here:
There are two pieces of code making that happen. The first, matrix.pde, is running on the Arduino, set up to accept incoming bytes and display them on the little screen. It's super dumb, but it's got scan lines and an off-screen buffer to reduce flicker, so I'm happy with how it works. The second, fade.py, is running on my laptop and pumping strings of binary data over a serial connection to make the pretty pictures. At the moment, it's fading from white to black and back and sending dithered versions of those images over the wire. If my math is right, it should be able to do this at least 100 times per second without breaking a sweat, so I'm thrilled with the time resolution.
I'm not yet sure where this goes next, but I'm going to try running some simple video over the wire to see whether it's even remotely recognizeable as an image.
subscribe to ![]() this site.
|
contact Michal Migurski
this site.
|
contact Michal Migurski